33
/fr/
AIzaSyAYiBZKx7MnpbEhh9jyipgxe19OcubqV5w
May 1, 2025
238200
Seychelles
SYC
true
2
1
Expense (% of GDP)
2015,2014,2013,2012,2011,2010,2009,2008,2007,2006,2005,2004,2003,2002,2001,2000,1999,1998,1997,1996,1995,1994,1990,1989,1988,1987,1986
Download
Bibliothèque de statistiques globales →Seychelles →

Expense (% of GDP)

Cette statistique dans les autres pays:

AfghanistanAlbaniaAlgeriaAngolaAntigua and BarbudaArmeniaAustraliaAustriaAzerbaijanBahamas, TheBahrainBangladeshBarbadosBelarusBelgiumBelizeBeninBhutanBoliviaBosnia and HerzegovinaBotswanaBrazilBulgariaBurkina FasoBurundiCabo VerdeCambodiaCanadaCaribbean small statesCentral African RepublicCentral Europe and the BalticsChileColombiaCongo, Dem. Rep.Congo, Rep.Costa RicaCote d'IvoireCroatiaCyprusCzech RepublicDenmarkDominicaDominican RepublicEarly-demographic dividendEgypt, Arab Rep.El SalvadorEquatorial GuineaEstoniaEthiopiaEuro areaEurope & Central AsiaEurope & Central Asia (excluding high income)Europe & Central Asia (IDA & IBRD countries)European UnionFijiFinlandFranceGambia, TheGeorgiaGermanyGhanaGreeceGrenadaGuatemalaHeavily indebted poor countries (HIPC)High incomeHondurasHong Kong SAR, ChinaHungaryIcelandIDA blendIDA onlyIDA totalIndiaIndonesiaIran, Islamic Rep.IraqIrelandIsraelItalyJamaicaJapanJordanKazakhstanKenyaKiribatiKorea, Rep.KuwaitKyrgyz RepublicLao PDRLatin America & Caribbean Latin America & Caribbean (excluding high income)Latin America & the Caribbean (IDA & IBRD countries)LatviaLeast developed countries: UN classificationLebanonLesothoLiberiaLithuaniaLow incomeLower middle incomeLuxembourgMacao SAR, ChinaMacedonia, FYRMadagascarMalawiMalaysiaMaldivesMaliMaltaMauritiusMexicoMicronesia, Fed. Sts.Middle East & North Africa (excluding high income)Middle East & North Africa (IDA & IBRD countries)MoldovaMongoliaMoroccoMozambiqueMyanmarNamibiaNepalNetherlandsNew ZealandNicaraguaNigeriaNorth AmericaNorwayOECD membersOmanOther small statesPacific island small statesPakistanPanamaPapua New GuineaParaguayPeruPhilippinesPolandPortugalPost-demographic dividendPre-demographic dividendQatarRomaniaRussian FederationRwandaSamoaSan MarinoSao Tome and PrincipeSenegalSerbiaSeychellesSierra LeoneSingaporeSlovak RepublicSloveniaSmall statesSolomon IslandsSouth AfricaSouth AsiaSouth Asia (IDA & IBRD)SpainSri LankaSt. Kitts and NevisSt. LuciaSub-Saharan Africa Sub-Saharan Africa (excluding high income)Sub-Saharan Africa (IDA & IBRD countries)SurinameSwazilandSwedenSwitzerlandSyrian Arab RepublicTajikistanTanzaniaThailandTimor-LesteTogoTrinidad and TobagoTunisiaTurkeyUgandaUkraineUnited Arab EmiratesUnited KingdomUnited StatesUruguayVanuatuVenezuela, RBVietnamWest Bank and GazaWorldYemen, Rep.ZambiaZimbabwe

La ligne de temps

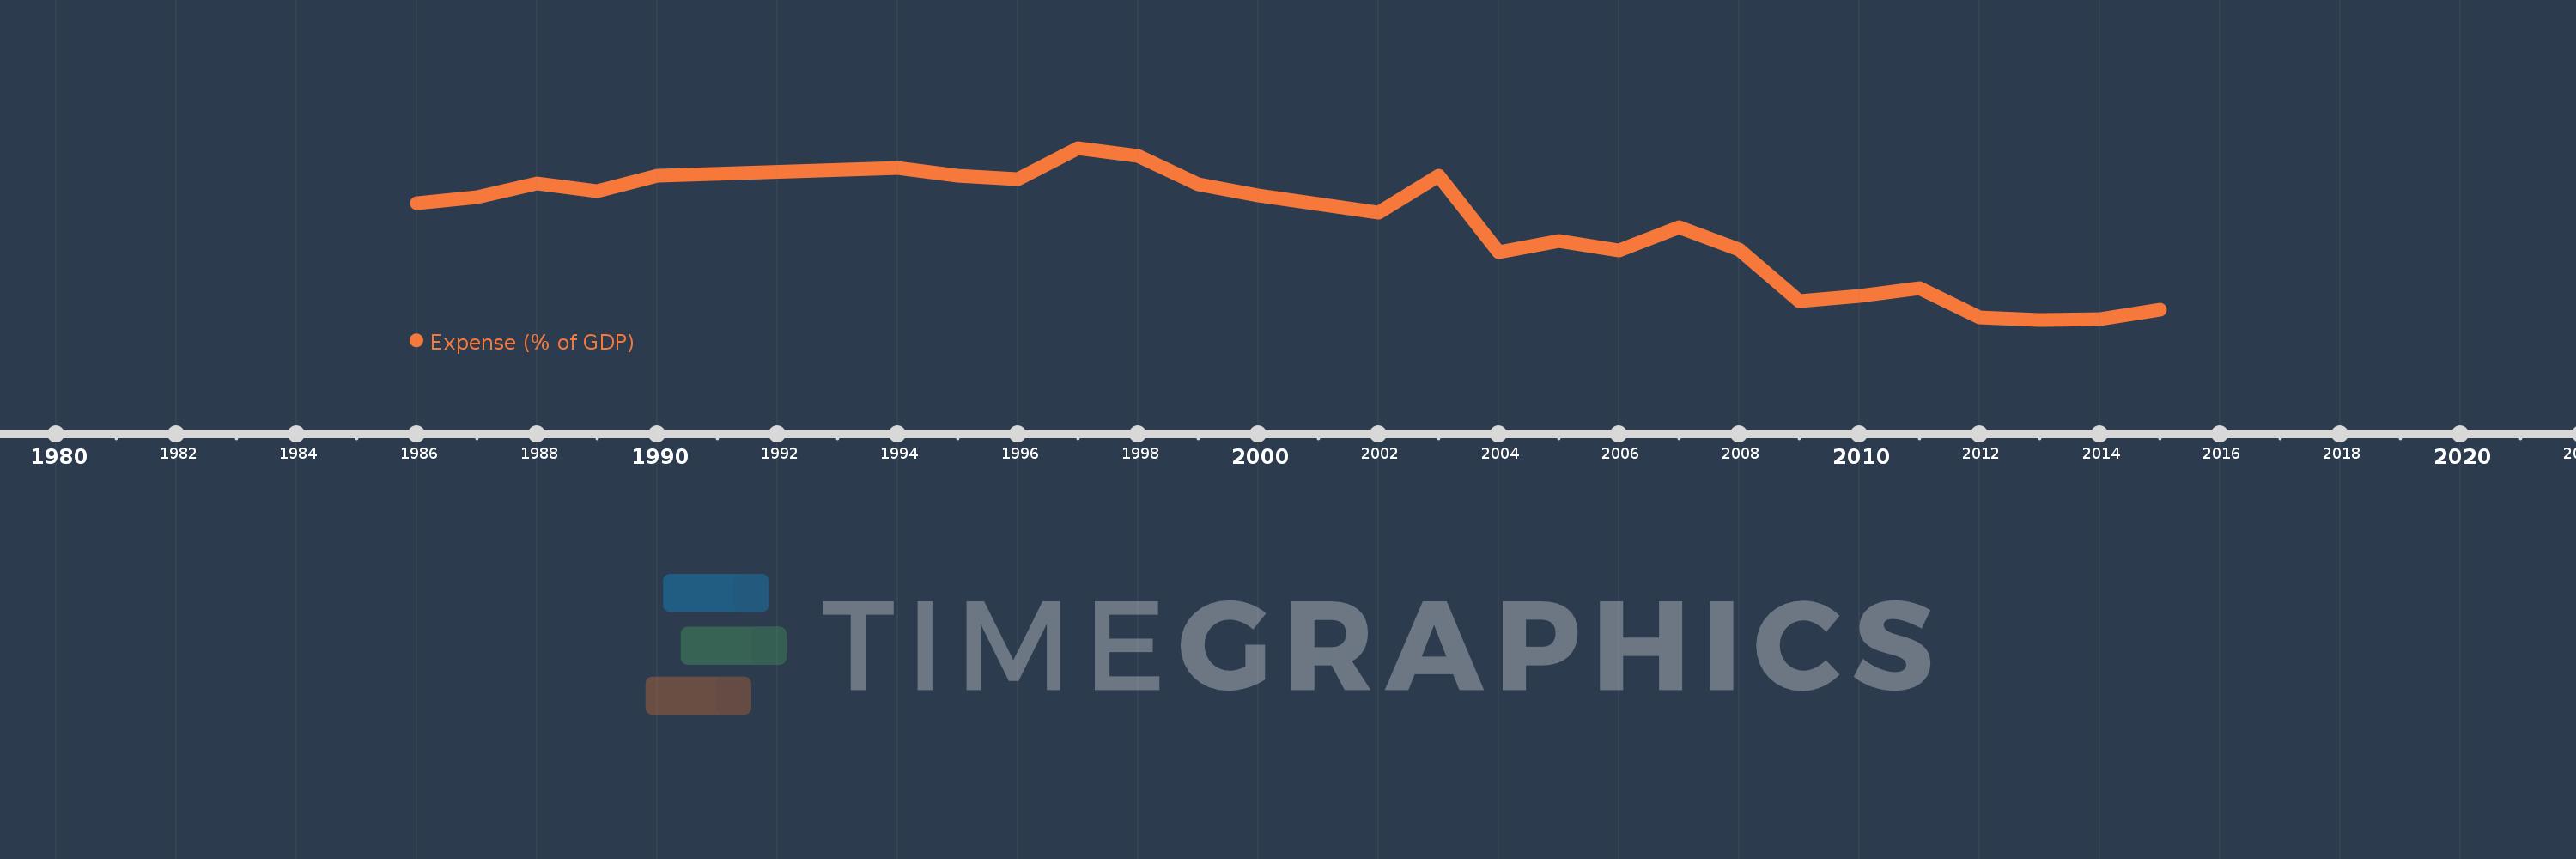
Cette échelle de temps montre un graphique de 1986 année à 2015 année Seychelles. Les données jusqu'à 1985 année ne sont pas présentés. Quantité d'observations actuelles selon dates: 27.

Source (désignation):

Les indicateurs du développement mondiale

Source (organisation):

International Monetary Fund, Government Finance Statistics Yearbook and data files, and World Bank and OECD GDP estimates.

Catégories:

Economy & Growth, Public Sector

Dernière mise à jour

23 avr. 2017

Les indicateurs de changement de valeurs selon les années

En moyenne:
39.76
Minimum:
25.963
1 janv. 2013
Maximum:
51.46
1 janv. 1997
Pour la date d''observation
Valeur
Changement absolu
Le changement par rapport à la valeur précédente
1 janv. 1986
43.199
+43.199
0.0%
1 janv. 1987
44.133
+0.934
2.16%
1 janv. 1988
46.142
+2.009
4.55%
1 janv. 1989
45.019
-1.123
-2.43%
1 janv. 1990
47.298
+2.279
5.06%
1 janv. 1994
48.465
+1.167
2.47%
1 janv. 1995
47.288
-1.177
-2.43%
1 janv. 1996
46.845
-0.443
-0.94%
1 janv. 1997
51.46
+4.615
9.85%
1 janv. 1998
50.318
-1.142
-2.22%
1 janv. 1999
46.081
-4.237
-8.42%
1 janv. 2000
44.425
-1.656
-3.59%
1 janv. 2001
43.125
-1.3
-2.93%
1 janv. 2002
41.886
-1.239
-2.87%
1 janv. 2003
47.366
+5.48
13.08%
1 janv. 2004
36.011
-11.354
-23.97%
1 janv. 2005
37.639
+1.627
4.52%
1 janv. 2006
36.269
-1.37
-3.64%
1 janv. 2007
39.643
+3.374
9.3%
1 janv. 2008
36.354
-3.289
-8.3%
1 janv. 2009
28.7
-7.654
-21.05%
1 janv. 2010
29.466
+0.766
2.67%
1 janv. 2011
30.63
+1.164
3.95%
1 janv. 2012
26.3
-4.33
-14.14%
1 janv. 2013
25.963
-0.337
-1.28%
1 janv. 2014
26.021
+0.058
0.22%
1 janv. 2015
27.464
+1.444
5.55%

Classement des pays selon les statistiques actuelles par années