33
/fr/
AIzaSyAYiBZKx7MnpbEhh9jyipgxe19OcubqV5w
May 1, 2025
215215
Oman
OMN
true
2
1
Expense (% of GDP)
2014,2013,2012,2011,2010,2009,2008,2007,2006,2005,2004,2003,2002,2001,2000,1999,1998,1997,1996,1995,1994,1993,1992,1991
Download
Bibliothèque de statistiques globales →Oman →

Expense (% of GDP)

Cette statistique dans les autres pays:

AfghanistanAlbaniaAlgeriaAngolaAntigua and BarbudaArmeniaAustraliaAustriaAzerbaijanBahamas, TheBahrainBangladeshBarbadosBelarusBelgiumBelizeBeninBhutanBoliviaBosnia and HerzegovinaBotswanaBrazilBulgariaBurkina FasoBurundiCabo VerdeCambodiaCanadaCaribbean small statesCentral African RepublicCentral Europe and the BalticsChileColombiaCongo, Dem. Rep.Congo, Rep.Costa RicaCote d'IvoireCroatiaCyprusCzech RepublicDenmarkDominicaDominican RepublicEarly-demographic dividendEgypt, Arab Rep.El SalvadorEquatorial GuineaEstoniaEthiopiaEuro areaEurope & Central AsiaEurope & Central Asia (excluding high income)Europe & Central Asia (IDA & IBRD countries)European UnionFijiFinlandFranceGambia, TheGeorgiaGermanyGhanaGreeceGrenadaGuatemalaHeavily indebted poor countries (HIPC)High incomeHondurasHong Kong SAR, ChinaHungaryIcelandIDA blendIDA onlyIDA totalIndiaIndonesiaIran, Islamic Rep.IraqIrelandIsraelItalyJamaicaJapanJordanKazakhstanKenyaKiribatiKorea, Rep.KuwaitKyrgyz RepublicLao PDRLatin America & Caribbean Latin America & Caribbean (excluding high income)Latin America & the Caribbean (IDA & IBRD countries)LatviaLeast developed countries: UN classificationLebanonLesothoLiberiaLithuaniaLow incomeLower middle incomeLuxembourgMacao SAR, ChinaMacedonia, FYRMadagascarMalawiMalaysiaMaldivesMaliMaltaMauritiusMexicoMicronesia, Fed. Sts.Middle East & North Africa (excluding high income)Middle East & North Africa (IDA & IBRD countries)MoldovaMongoliaMoroccoMozambiqueMyanmarNamibiaNepalNetherlandsNew ZealandNicaraguaNigeriaNorth AmericaNorwayOECD membersOmanOther small statesPacific island small statesPakistanPanamaPapua New GuineaParaguayPeruPhilippinesPolandPortugalPost-demographic dividendPre-demographic dividendQatarRomaniaRussian FederationRwandaSamoaSan MarinoSao Tome and PrincipeSenegalSerbiaSeychellesSierra LeoneSingaporeSlovak RepublicSloveniaSmall statesSolomon IslandsSouth AfricaSouth AsiaSouth Asia (IDA & IBRD)SpainSri LankaSt. Kitts and NevisSt. LuciaSub-Saharan Africa Sub-Saharan Africa (excluding high income)Sub-Saharan Africa (IDA & IBRD countries)SurinameSwazilandSwedenSwitzerlandSyrian Arab RepublicTajikistanTanzaniaThailandTimor-LesteTogoTrinidad and TobagoTunisiaTurkeyUgandaUkraineUnited Arab EmiratesUnited KingdomUnited StatesUruguayVanuatuVenezuela, RBVietnamWest Bank and GazaWorldYemen, Rep.ZambiaZimbabwe

La ligne de temps

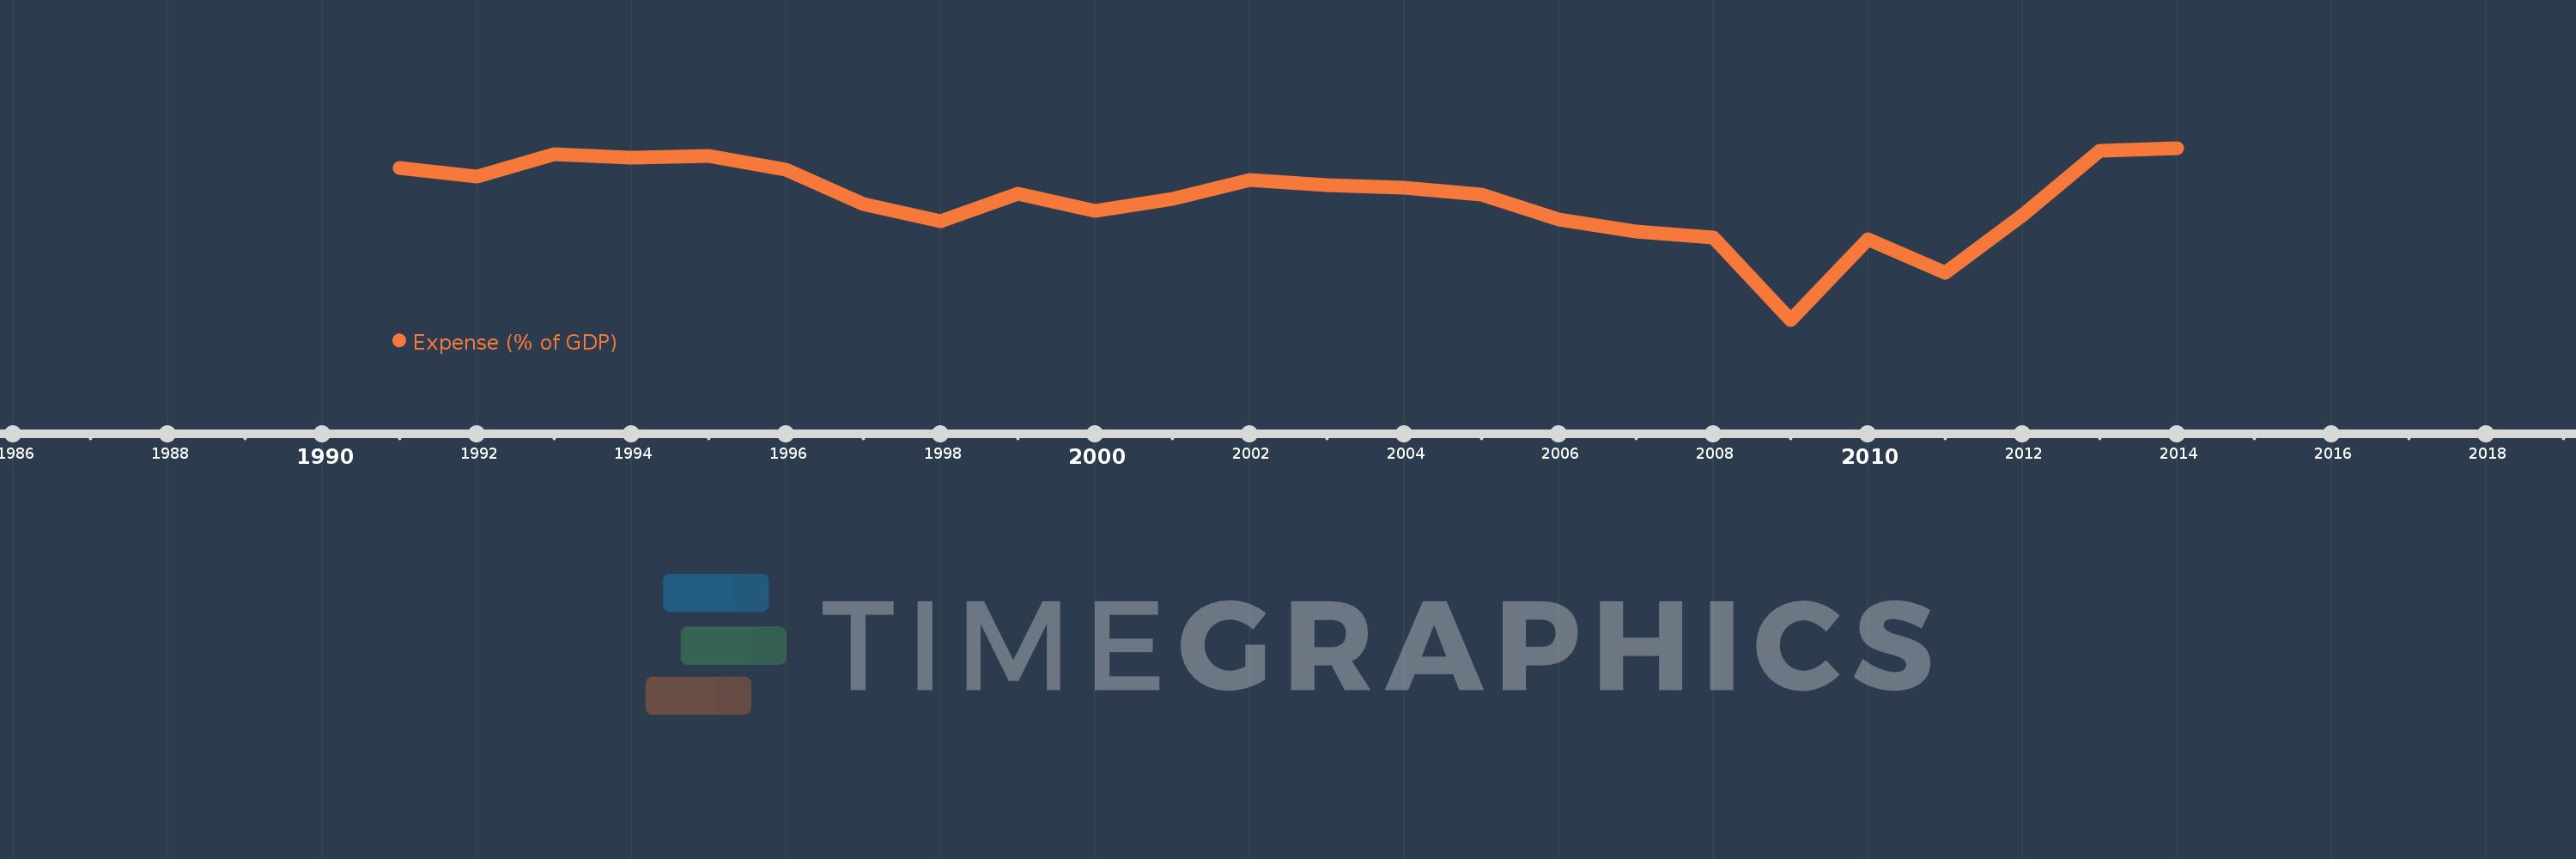
Cette échelle de temps montre un graphique de 1991 année à 2014 année Oman. Les données jusqu'à 1990 année ne sont pas présentés. Quantité d'observations actuelles selon dates: 24.

Source (désignation):

Les indicateurs du développement mondiale

Source (organisation):

International Monetary Fund, Government Finance Statistics Yearbook and data files, and World Bank and OECD GDP estimates.

Catégories:

Economy & Growth, Public Sector

Dernière mise à jour

23 avr. 2017

Les indicateurs de changement de valeurs selon les années

En moyenne:
29.481
Minimum:
17.863
1 janv. 2009
Maximum:
34.488
1 janv. 2014
Pour la date d''observation
Valeur
Changement absolu
Le changement par rapport à la valeur précédente
1 janv. 1991
32.536
+32.536
0.0%
1 janv. 1992
31.717
-0.819
-2.52%
1 janv. 1993
33.9
+2.183
6.88%
1 janv. 1994
33.556
-0.344
-1.01%
1 janv. 1995
33.702
+0.146
0.44%
1 janv. 1996
32.359
-1.344
-3.99%
1 janv. 1997
29.049
-3.31
-10.23%
1 janv. 1998
27.429
-1.619
-5.57%
1 janv. 1999
30.08
+2.651
9.67%
1 janv. 2000
28.38
-1.701
-5.65%
1 janv. 2001
29.54
+1.16
4.09%
1 janv. 2002
31.356
+1.816
6.15%
1 janv. 2003
30.89
-0.466
-1.49%
1 janv. 2004
30.65
-0.24
-0.78%
1 janv. 2005
30.009
-0.641
-2.09%
1 janv. 2006
27.541
-2.468
-8.22%
1 janv. 2007
26.371
-1.17
-4.25%
1 janv. 2008
25.851
-0.52
-1.97%
1 janv. 2009
17.863
-7.988
-30.9%
1 janv. 2010
25.637
+7.774
43.52%
1 janv. 2011
22.382
-3.255
-12.7%
1 janv. 2012
28.02
+5.638
25.19%
1 janv. 2013
34.239
+6.219
22.2%
1 janv. 2014
34.488
+0.249
0.73%

Classement des pays selon les statistiques actuelles par années