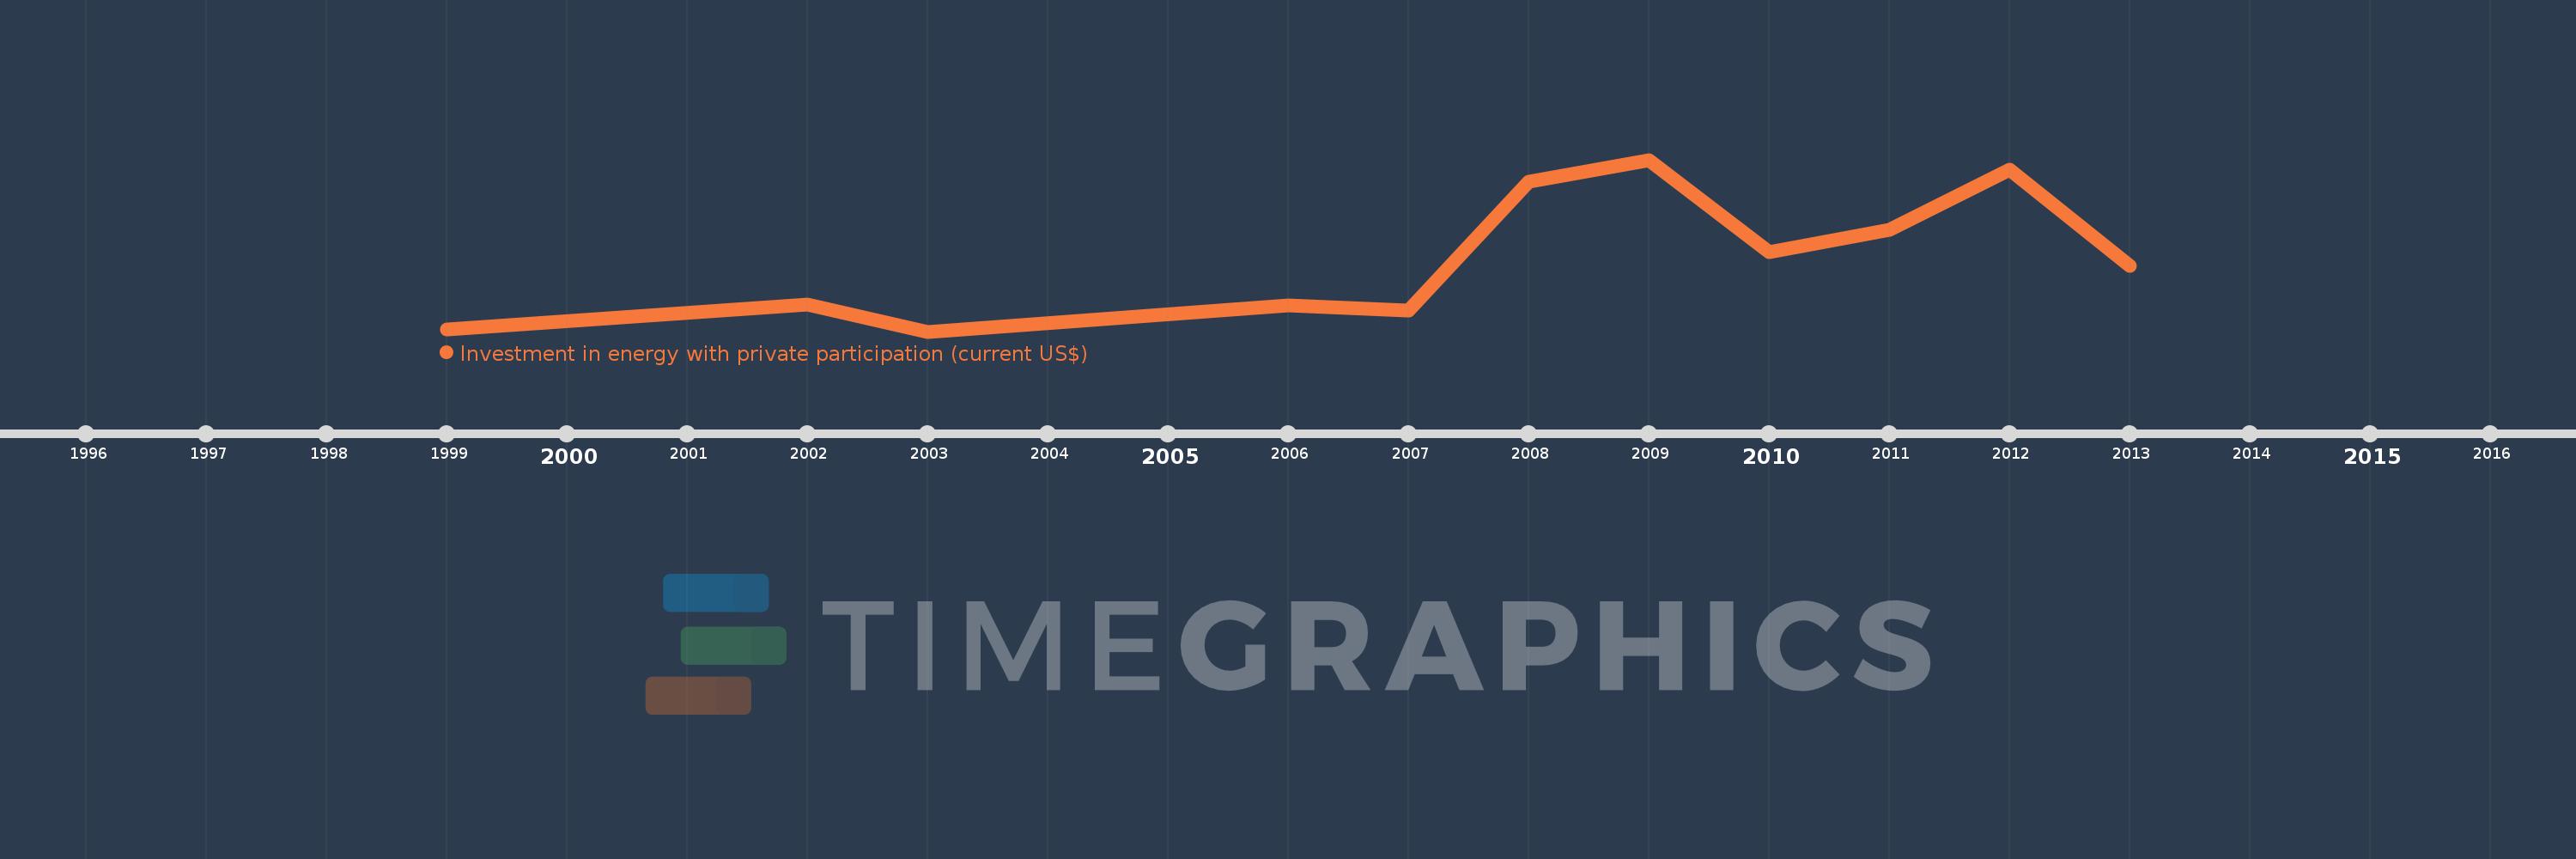
Cette échelle de temps montre un graphique de 1999 année à 2013 année Europe & Central Asia (excluding high income). Les données jusqu'à 1998 année ne sont pas présentés. Quantité d'observations actuelles selon dates: 11.
Source (désignation):
Les indicateurs du développement mondiale
Source (organisation):
World Bank, Private Participation in Infrastructure Project Database (http://ppi.worldbank.org).
Catégories:
Energy & Mining, Infrastructure, Private Sector
Dernière mise à jour
23 avr. 2017
Les indicateurs de changement de valeurs selon les années
En moyenne:
9.201 mds
Minimum:
612.2 mln.
1 janv. 2003
Maximum:
20.747 mds
1 janv. 2009
Pour la date d''observation
Valeur
Changement absolu
Le changement par rapport à la valeur précédente
1 janv. 1999
879.0 mln.
+879.0 mln.
0.0%
1 janv. 2002
3.79 mds
+2.911 mds
331.17%
1 janv. 2003
612.2 mln.
-3.178 mds
-83.85%
1 janv. 2006
3.647 mds
+3.034 mds
495.66%
1 janv. 2007
3.096 mds
-551.1 mln.
-15.11%
1 janv. 2008
18.169 mds
+15.074 mds
486.95%
1 janv. 2009
20.747 mds
+2.578 mds
14.19%
1 janv. 2010
9.881 mds
-10.866 mds
-52.37%
1 janv. 2011
12.504 mds
+2.623 mds
26.54%
1 janv. 2012
19.614 mds
+7.11 mds
56.86%
1 janv. 2013
8.274 mds
-11.34 mds
-57.82%
Classement des pays selon les statistiques actuelles par années