Download Cette statistique dans les autres pays:
La ligne de temps
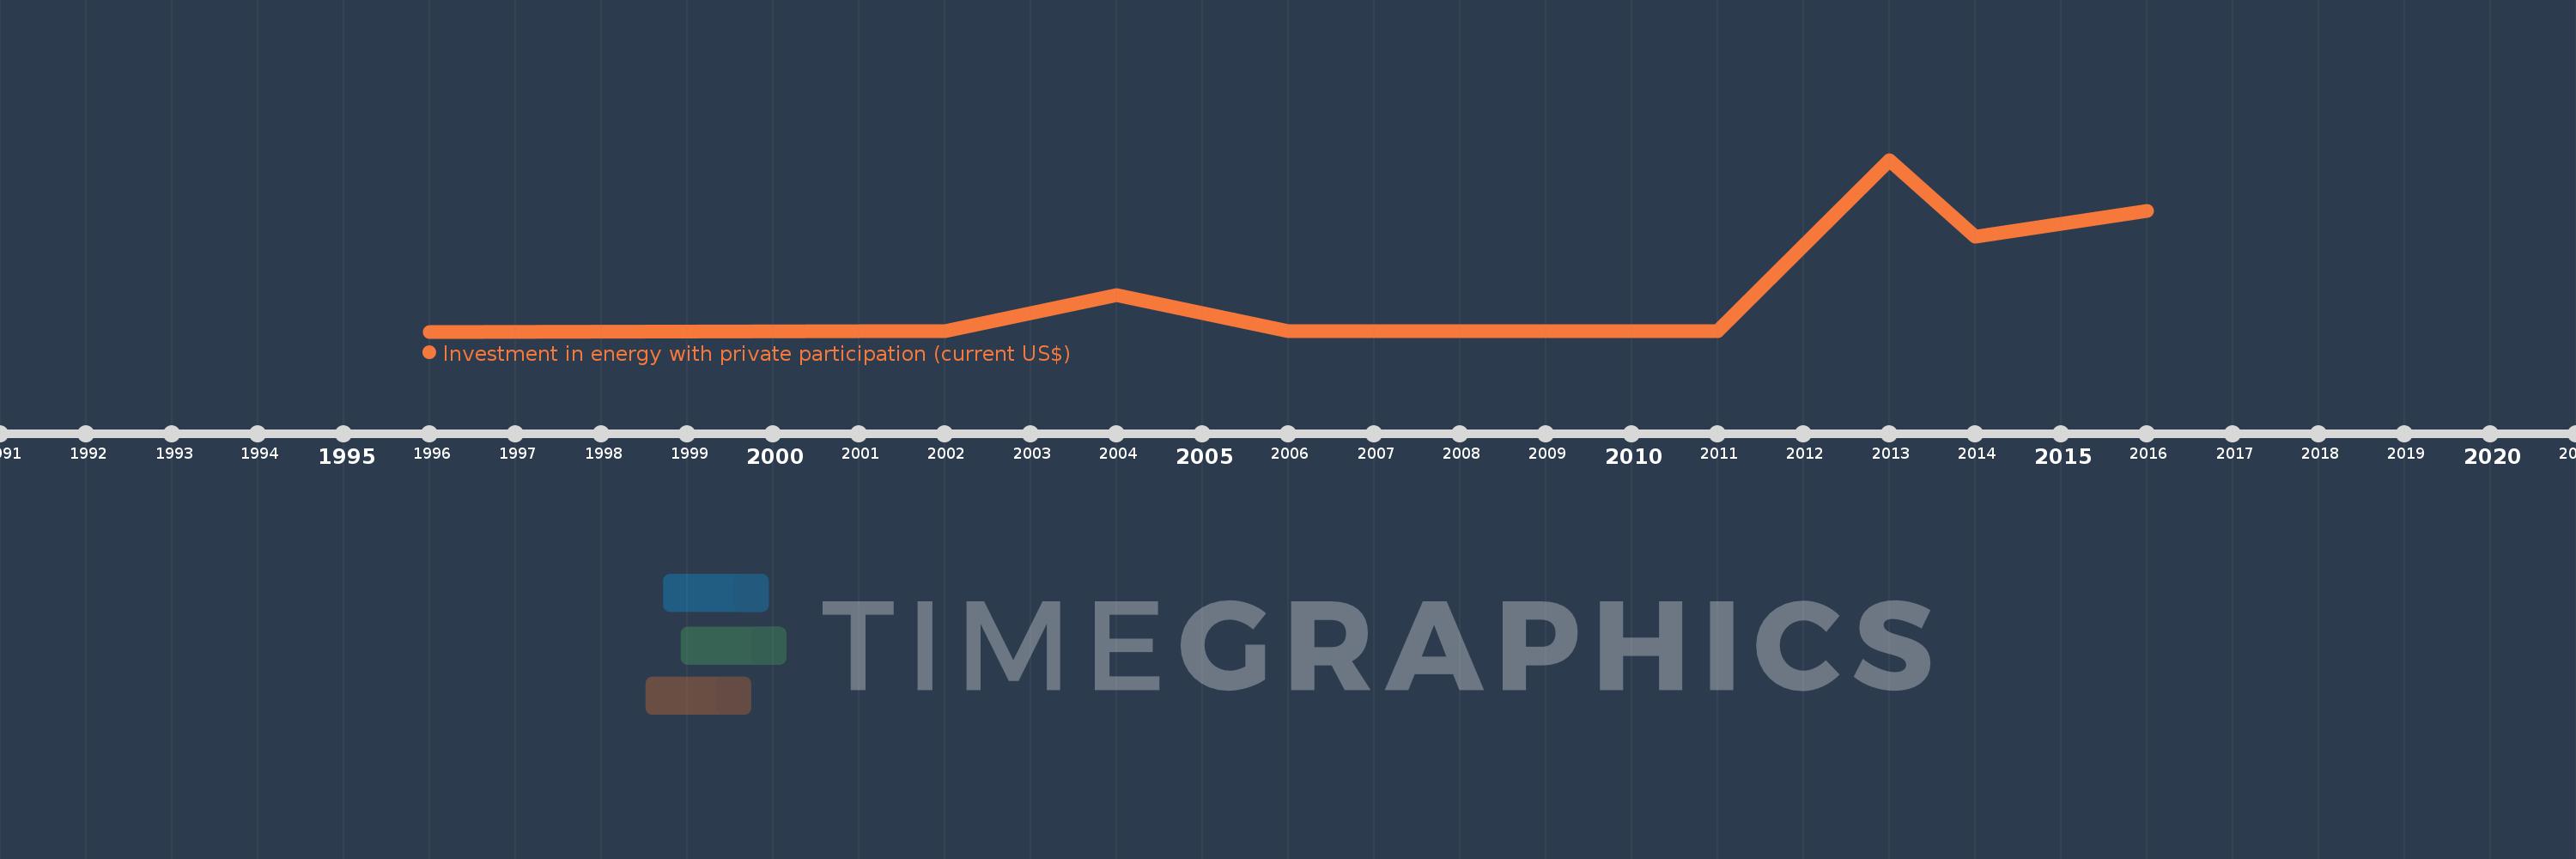
Cette échelle de temps montre un graphique de 1996 année à 2016 année South Africa. Les données jusqu'à 1995 année ne sont pas présentés. Quantité d'observations actuelles selon dates: 10.
Source (désignation):
Les indicateurs du développement mondiale
Source (organisation):
World Bank, Private Participation in Infrastructure Project Database (http://ppi.worldbank.org).
Catégories:
Energy & Mining, Infrastructure, Private Sector
Dernière mise à jour
23 avr. 2017
Les indicateurs de changement de valeurs selon les années
Minimum:
3.0 mln.
1 janv. 1996
Maximum:
5.664 mds
1 janv. 2013
Pour la date d''observation
Valeur
Changement absolu
Le changement par rapport à la valeur précédente
1 janv. 1996
3.0 mln.
+3.0 mln.
0.0%
1 janv. 2001
15.9 mln.
+12.9 mln.
430.0%
1 janv. 2002
28.4 mln.
+12.5 mln.
78.62%
1 janv. 2004
1.2 mds
+1.172 mds
4.13 milles%
1 janv. 2006
7.0 mln.
-1.193 mds
-99.42%
1 janv. 2007
9.9 mln.
+2.9 mln.
41.43%
1 janv. 2011
6.0 mln.
-3.9 mln.
-39.39%
1 janv. 2013
5.664 mds
+5.658 mds
94.3 milles%
1 janv. 2014
3.132 mds
-2.532 mds
-44.7%
1 janv. 2016
3.973 mds
+841.25 mln.
26.86%
Classement des pays selon les statistiques actuelles par années