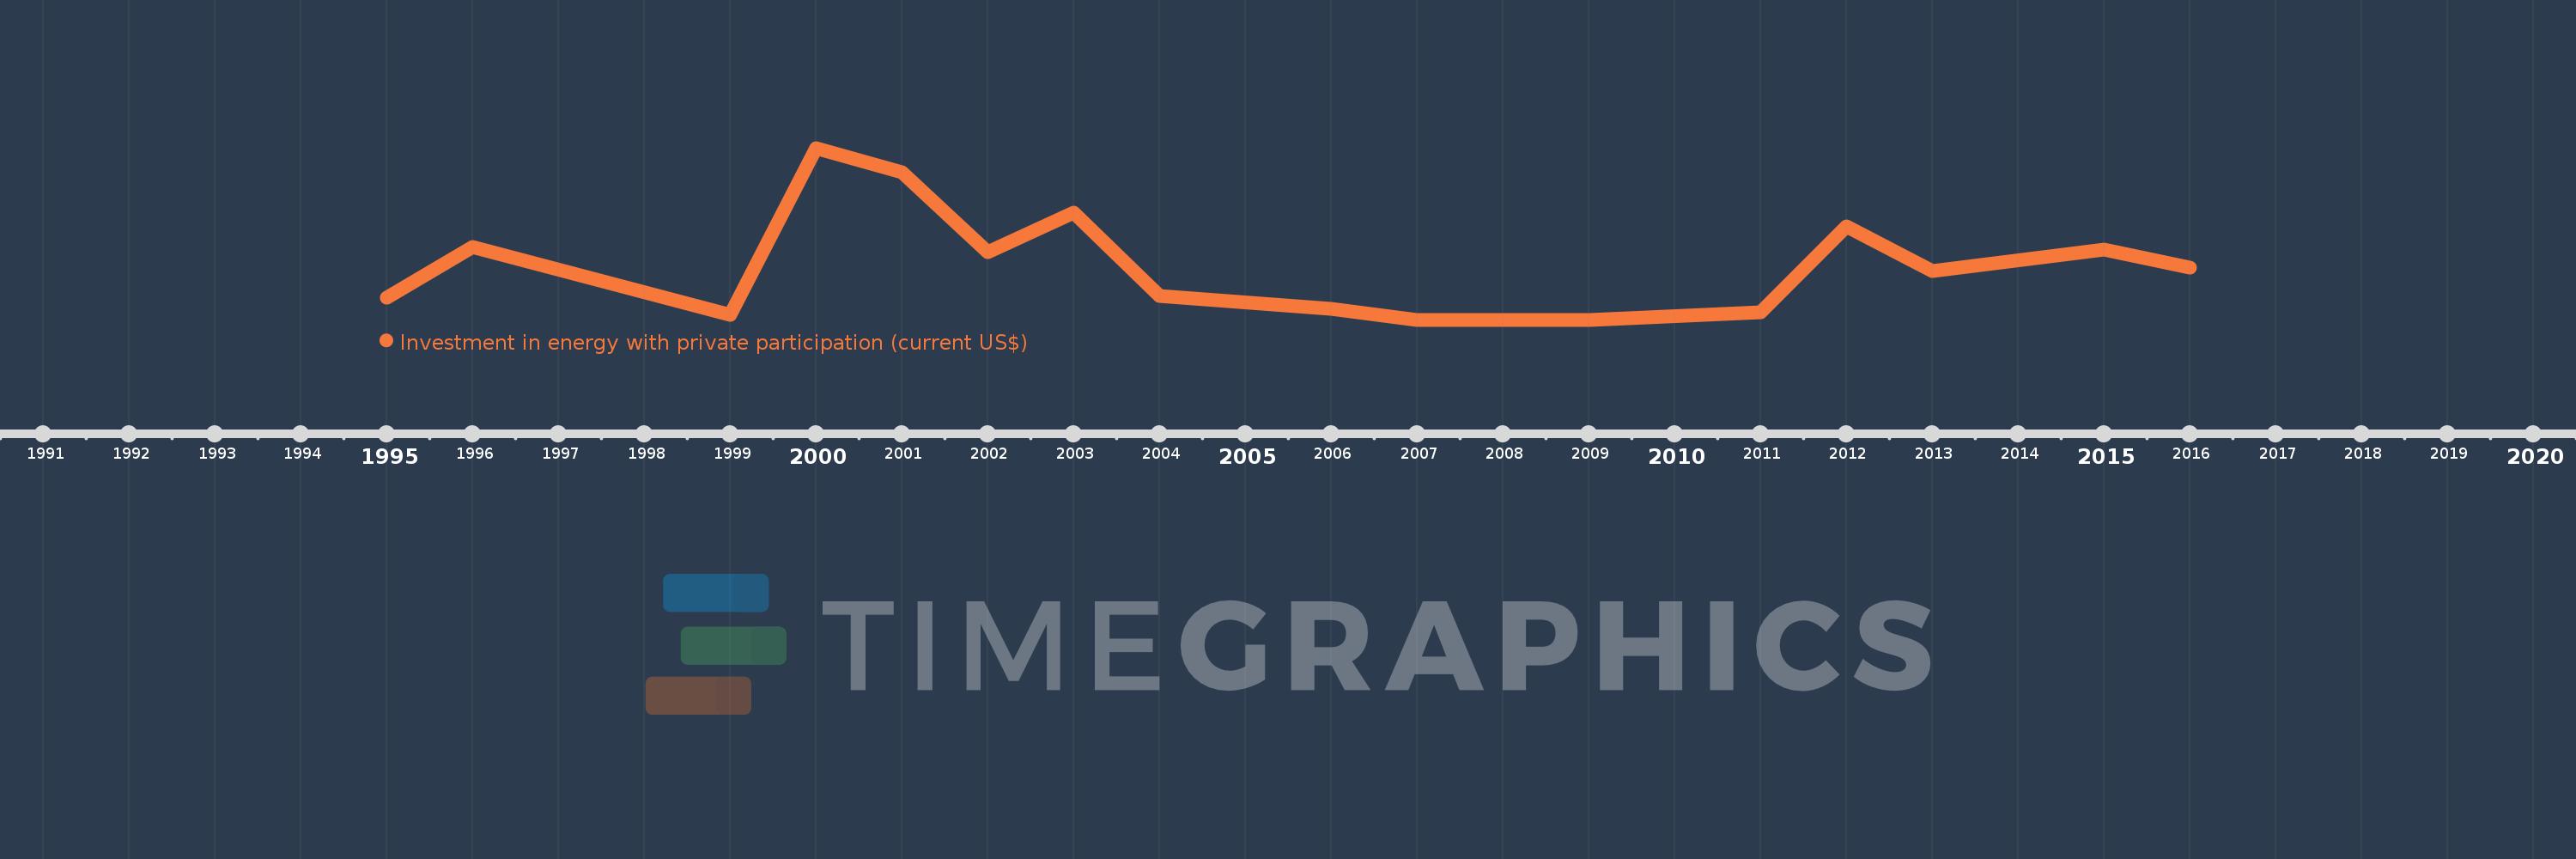
Cette échelle de temps montre un graphique de 1995 année à 2016 année Dominican Republic. Les données jusqu'à 1994 année ne sont pas présentés. Quantité d'observations actuelles selon dates: 16.
Source (désignation):
Les indicateurs du développement mondiale
Source (organisation):
World Bank, Private Participation in Infrastructure Project Database (http://ppi.worldbank.org).
Catégories:
Energy & Mining, Infrastructure, Private Sector
Dernière mise à jour
23 avr. 2017
Les indicateurs de changement de valeurs selon les années
En moyenne:
220.956 mln.
Minimum:
0.0
1 janv. 2007
Maximum:
674.0 mln.
1 janv. 2000
Pour la date d''observation
Valeur
Changement absolu
Le changement par rapport à la valeur précédente
1 janv. 1995
87.5 mln.
+87.5 mln.
0.0%
1 janv. 1996
285.0 mln.
+197.5 mln.
225.71%
1 janv. 1999
20.0 mln.
-265.0 mln.
-92.98%
1 janv. 2000
674.0 mln.
+654.0 mln.
3.27 milles%
1 janv. 2001
577.3 mln.
-96.7 mln.
-14.35%
1 janv. 2002
265.0 mln.
-312.3 mln.
-54.1%
1 janv. 2003
421.8 mln.
+156.8 mln.
59.17%
1 janv. 2004
95.0 mln.
-326.8 mln.
-77.48%
1 janv. 2006
42.5 mln.
-52.5 mln.
-55.26%
1 janv. 2007
0.0
-42.5 mln.
-100.0%
1 janv. 2009
0.0
0.0
%
1 janv. 2011
30.0 mln.
+30.0 mln.
%
1 janv. 2012
365.7 mln.
+335.7 mln.
1.12 milles%
1 janv. 2013
190.0 mln.
-175.7 mln.
-48.04%
1 janv. 2015
277.0 mln.
+87.0 mln.
45.79%
1 janv. 2016
204.5 mln.
-72.5 mln.
-26.17%
Classement des pays selon les statistiques actuelles par années