30
/fr/
AIzaSyAYiBZKx7MnpbEhh9jyipgxe19OcubqV5w
April 1, 2024
287911
Zimbabwe
ZWE
true
2
1
Service exports (BoP, current US$)
2016,2015,2014,2013,2012,2011,2010,1995,1994,1993,1992,1991,1990,1989,1988,1987,1986,1985,1984,1983,1982,1981,1980,1979,1978
Download
Bibliothèque de statistiques globales →Zimbabwe →

Service exports (BoP, current US$)

Cette statistique dans les autres pays:

AfghanistanAlbaniaAlgeriaAngolaAntigua and BarbudaArab WorldArgentinaArmeniaArubaAustraliaAustriaAzerbaijanBahamas, TheBahrainBangladeshBarbadosBelarusBelgiumBelizeBeninBermudaBhutanBoliviaBosnia and HerzegovinaBotswanaBrazilBrunei DarussalamBulgariaBurkina FasoBurundiCabo VerdeCambodiaCameroonCanadaCaribbean small statesCentral African RepublicCentral Europe and the BalticsChadChileChinaColombiaComorosCongo, Dem. Rep.Congo, Rep.Costa RicaCote d'IvoireCroatiaCuracaoCyprusCzech RepublicDenmarkDjiboutiDominicaDominican RepublicEarly-demographic dividendEast Asia & PacificEast Asia & Pacific (excluding high income)East Asia & Pacific (IDA & IBRD countries)EcuadorEgypt, Arab Rep.El SalvadorEquatorial GuineaEritreaEstoniaEthiopiaEuro areaEurope & Central AsiaEurope & Central Asia (excluding high income)Europe & Central Asia (IDA & IBRD countries)European UnionFaroe IslandsFijiFinlandFragile and conflict affected situationsFranceFrench PolynesiaGabonGambia, TheGeorgiaGermanyGhanaGreeceGrenadaGuatemalaGuineaGuinea-BissauGuyanaHaitiHeavily indebted poor countries (HIPC)High incomeHondurasHong Kong SAR, ChinaHungaryIBRD onlyIcelandIDA & IBRD totalIDA blendIDA onlyIDA totalIndiaIndonesiaIran, Islamic Rep.IraqIrelandIsraelItalyJamaicaJapanJordanKazakhstanKenyaKiribatiKorea, Rep.KosovoKuwaitKyrgyz RepublicLao PDRLate-demographic dividendLatin America & Caribbean Latin America & Caribbean (excluding high income)Latin America & the Caribbean (IDA & IBRD countries)LatviaLeast developed countries: UN classificationLebanonLesothoLiberiaLibyaLithuaniaLow & middle incomeLow incomeLower middle incomeLuxembourgMacao SAR, ChinaMacedonia, FYRMadagascarMalawiMalaysiaMaldivesMaliMaltaMarshall IslandsMauritaniaMauritiusMexicoMicronesia, Fed. Sts.Middle East & North Africa (excluding high income)Middle East & North Africa (IDA & IBRD countries)Middle incomeMoldovaMongoliaMontenegroMoroccoMozambiqueMyanmarNamibiaNepalNetherlandsNew CaledoniaNew ZealandNicaraguaNigerNigeriaNorth AmericaNorwayOECD membersOmanPacific island small statesPakistanPalauPanamaPapua New GuineaParaguayPeruPhilippinesPolandPortugalPost-demographic dividendPre-demographic dividendQatarRomaniaRussian FederationRwandaSamoaSao Tome and PrincipeSaudi ArabiaSenegalSerbiaSeychellesSierra LeoneSingaporeSint Maarten (Dutch part)Slovak RepublicSloveniaSolomon IslandsSouth AfricaSouth AsiaSouth Asia (IDA & IBRD)South SudanSpainSri LankaSt. Kitts and NevisSt. LuciaSt. Vincent and the GrenadinesSub-Saharan Africa Sub-Saharan Africa (excluding high income)Sub-Saharan Africa (IDA & IBRD countries)SudanSurinameSwazilandSwedenSwitzerlandSyrian Arab RepublicTajikistanTanzaniaThailandTimor-LesteTogoTongaTrinidad and TobagoTunisiaTurkeyTuvaluUgandaUkraineUnited KingdomUnited StatesUpper middle incomeUruguayVanuatuVenezuela, RBVietnamWest Bank and GazaWorldYemen, Rep.ZambiaZimbabwe

La ligne de temps

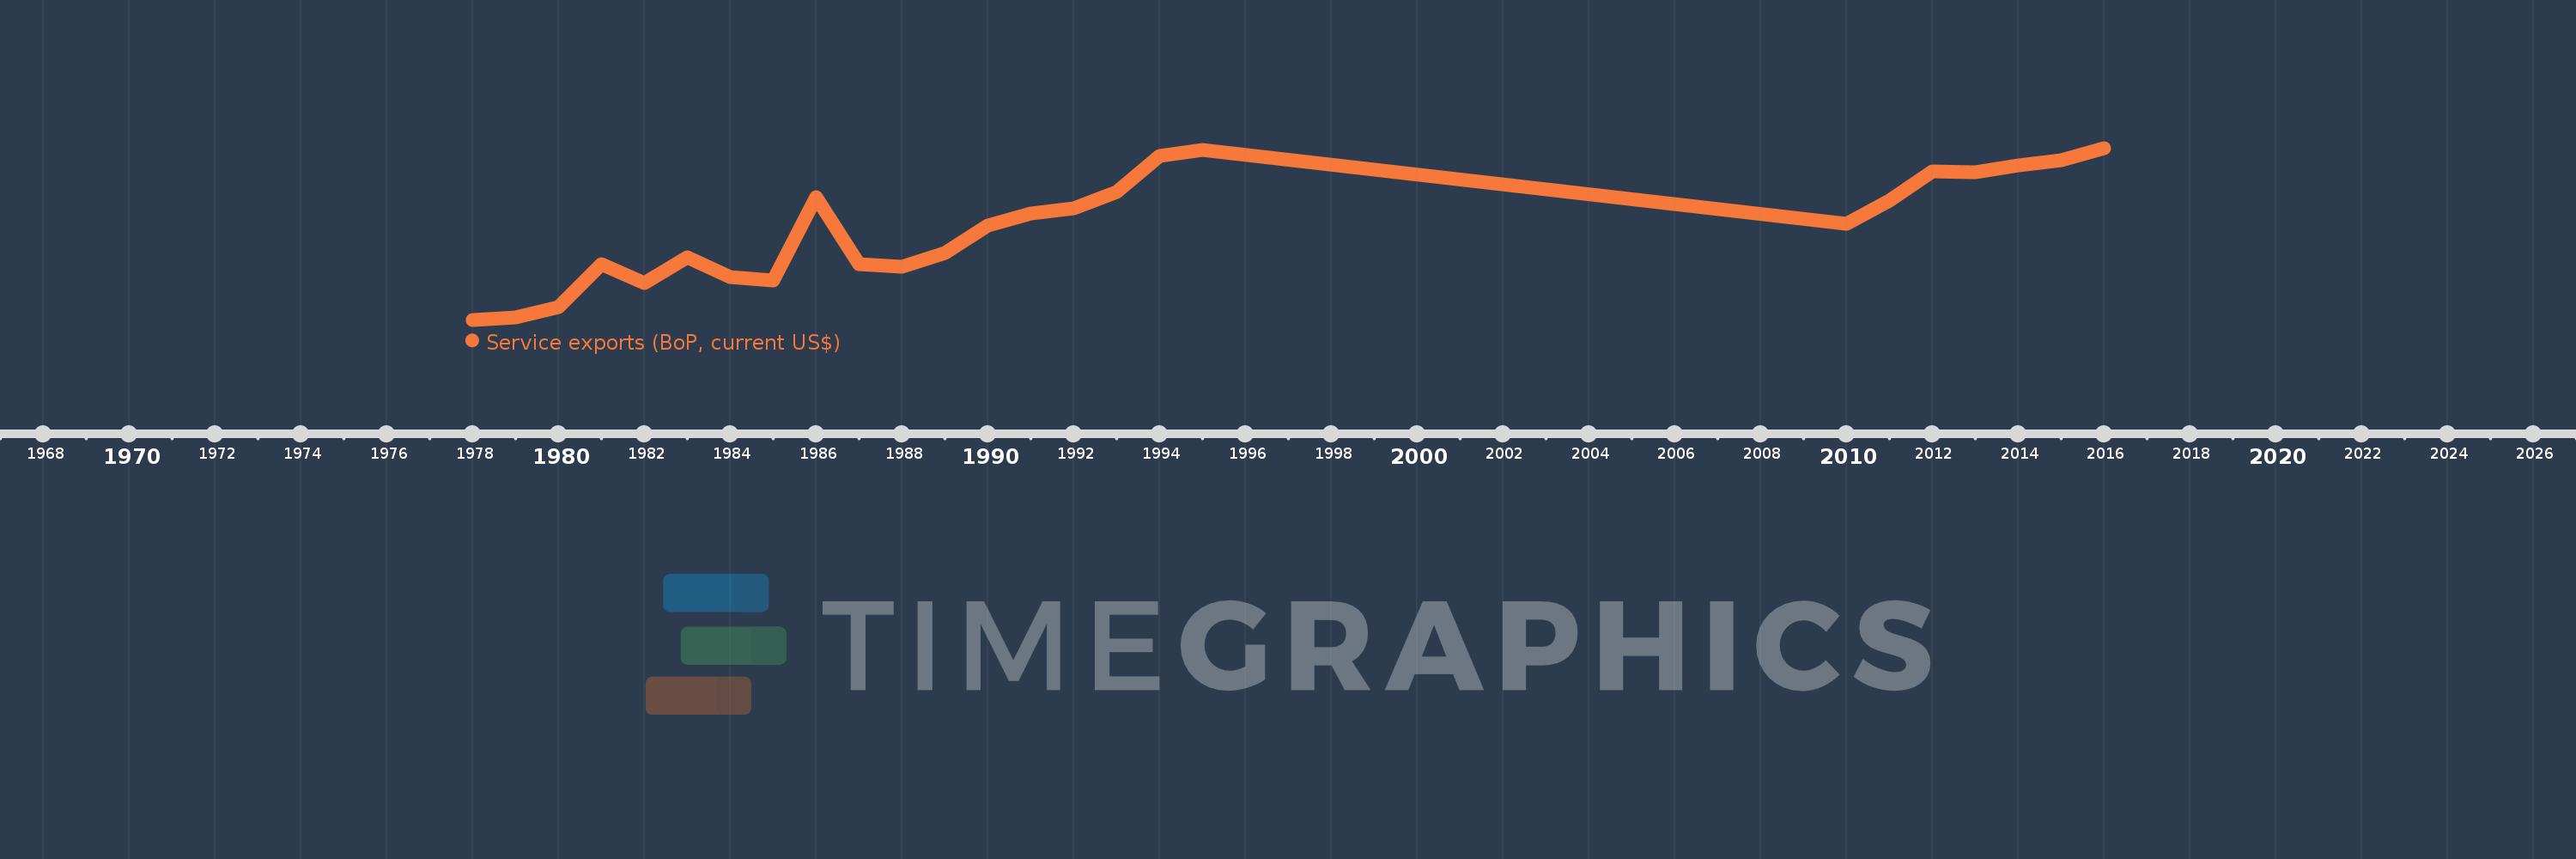
Cette échelle de temps montre un graphique de 1978 année à 2016 année Zimbabwe. Les données jusqu'à 1977 année ne sont pas présentés. Quantité d'observations actuelles selon dates: 25.

Source (désignation):

Les indicateurs du développement mondiale

Source (organisation):

International Monetary Fund, Balance of Payments Statistics Yearbook and data files.

Catégories:

Economy & Growth, Trade

Dernière mise à jour

23 avr. 2017

Les indicateurs de changement de valeurs selon les années

En moyenne:
238.768 mln.
Minimum:
65.176 mln.
1 janv. 1978
Maximum:
386.683 mln.
1 janv. 2016
Pour la date d''observation
Valeur
Changement absolu
Le changement par rapport à la valeur précédente
1 janv. 1978
65.176 mln.
+65.176 mln.
0.0%
1 janv. 1979
69.796 mln.
+4.62 mln.
7.09%
1 janv. 1980
88.171 mln.
+18.375 mln.
26.33%
1 janv. 1981
168.916 mln.
+80.745 mln.
91.58%
1 janv. 1982
134.001 mln.
-34.915 mln.
-20.67%
1 janv. 1983
181.316 mln.
+47.315 mln.
35.31%
1 janv. 1984
144.899 mln.
-36.417 mln.
-20.08%
1 janv. 1985
139.244 mln.
-5.655 mln.
-3.9%
1 janv. 1986
295.137 mln.
+155.893 mln.
111.96%
1 janv. 1987
168.849 mln.
-126.288 mln.
-42.79%
1 janv. 1988
164.447 mln.
-4.402 mln.
-2.61%
1 janv. 1989
190.127 mln.
+25.68 mln.
15.62%
1 janv. 1990
241.571 mln.
+51.444 mln.
27.06%
1 janv. 1991
263.899 mln.
+22.327 mln.
9.24%
1 janv. 1992
273.194 mln.
+9.295 mln.
3.52%
1 janv. 1993
304.742 mln.
+31.548 mln.
11.55%
1 janv. 1994
371.674 mln.
+66.932 mln.
21.96%
1 janv. 1995
382.802 mln.
+11.128 mln.
2.99%
1 janv. 2010
245.527 mln.
-137.275 mln.
-35.86%
1 janv. 2011
288.423 mln.
+42.896 mln.
17.47%
1 janv. 2012
342.571 mln.
+54.149 mln.
18.77%
1 janv. 2013
340.856 mln.
-1.715 mln.
-0.5%
1 janv. 2014
353.907 mln.
+13.051 mln.
3.83%
1 janv. 2015
363.264 mln.
+9.357 mln.
2.64%
1 janv. 2016
386.683 mln.
+23.42 mln.
6.45%

Classement des pays selon les statistiques actuelles par années