33
/fr/
AIzaSyAYiBZKx7MnpbEhh9jyipgxe19OcubqV5w
August 1, 2025
120474
Djibouti
DJI
true
2
1
Service exports (BoP, current US$)
2016,2015,2014,2013,2012,2011,2010,2009,2008,2007,2006,2005,2004,2003,2002,2001,2000,1999,1998,1997,1996,1995,1994,1993,1992
Download
Bibliothèque de statistiques globales →Djibouti →

Service exports (BoP, current US$)

Cette statistique dans les autres pays:

AfghanistanAlbaniaAlgeriaAngolaAntigua and BarbudaArab WorldArgentinaArmeniaArubaAustraliaAustriaAzerbaijanBahamas, TheBahrainBangladeshBarbadosBelarusBelgiumBelizeBeninBermudaBhutanBoliviaBosnia and HerzegovinaBotswanaBrazilBrunei DarussalamBulgariaBurkina FasoBurundiCabo VerdeCambodiaCameroonCanadaCaribbean small statesCentral African RepublicCentral Europe and the BalticsChadChileChinaColombiaComorosCongo, Dem. Rep.Congo, Rep.Costa RicaCote d'IvoireCroatiaCuracaoCyprusCzech RepublicDenmarkDjiboutiDominicaDominican RepublicEarly-demographic dividendEast Asia & PacificEast Asia & Pacific (excluding high income)East Asia & Pacific (IDA & IBRD countries)EcuadorEgypt, Arab Rep.El SalvadorEquatorial GuineaEritreaEstoniaEthiopiaEuro areaEurope & Central AsiaEurope & Central Asia (excluding high income)Europe & Central Asia (IDA & IBRD countries)European UnionFaroe IslandsFijiFinlandFragile and conflict affected situationsFranceFrench PolynesiaGabonGambia, TheGeorgiaGermanyGhanaGreeceGrenadaGuatemalaGuineaGuinea-BissauGuyanaHaitiHeavily indebted poor countries (HIPC)High incomeHondurasHong Kong SAR, ChinaHungaryIBRD onlyIcelandIDA & IBRD totalIDA blendIDA onlyIDA totalIndiaIndonesiaIran, Islamic Rep.IraqIrelandIsraelItalyJamaicaJapanJordanKazakhstanKenyaKiribatiKorea, Rep.KosovoKuwaitKyrgyz RepublicLao PDRLate-demographic dividendLatin America & Caribbean Latin America & Caribbean (excluding high income)Latin America & the Caribbean (IDA & IBRD countries)LatviaLeast developed countries: UN classificationLebanonLesothoLiberiaLibyaLithuaniaLow & middle incomeLow incomeLower middle incomeLuxembourgMacao SAR, ChinaMacedonia, FYRMadagascarMalawiMalaysiaMaldivesMaliMaltaMarshall IslandsMauritaniaMauritiusMexicoMicronesia, Fed. Sts.Middle East & North Africa (excluding high income)Middle East & North Africa (IDA & IBRD countries)Middle incomeMoldovaMongoliaMontenegroMoroccoMozambiqueMyanmarNamibiaNepalNetherlandsNew CaledoniaNew ZealandNicaraguaNigerNigeriaNorth AmericaNorwayOECD membersOmanPacific island small statesPakistanPalauPanamaPapua New GuineaParaguayPeruPhilippinesPolandPortugalPost-demographic dividendPre-demographic dividendQatarRomaniaRussian FederationRwandaSamoaSao Tome and PrincipeSaudi ArabiaSenegalSerbiaSeychellesSierra LeoneSingaporeSint Maarten (Dutch part)Slovak RepublicSloveniaSolomon IslandsSouth AfricaSouth AsiaSouth Asia (IDA & IBRD)South SudanSpainSri LankaSt. Kitts and NevisSt. LuciaSt. Vincent and the GrenadinesSub-Saharan Africa Sub-Saharan Africa (excluding high income)Sub-Saharan Africa (IDA & IBRD countries)SudanSurinameSwazilandSwedenSwitzerlandSyrian Arab RepublicTajikistanTanzaniaThailandTimor-LesteTogoTongaTrinidad and TobagoTunisiaTurkeyTuvaluUgandaUkraineUnited KingdomUnited StatesUpper middle incomeUruguayVanuatuVenezuela, RBVietnamWest Bank and GazaWorldYemen, Rep.ZambiaZimbabwe

La ligne de temps

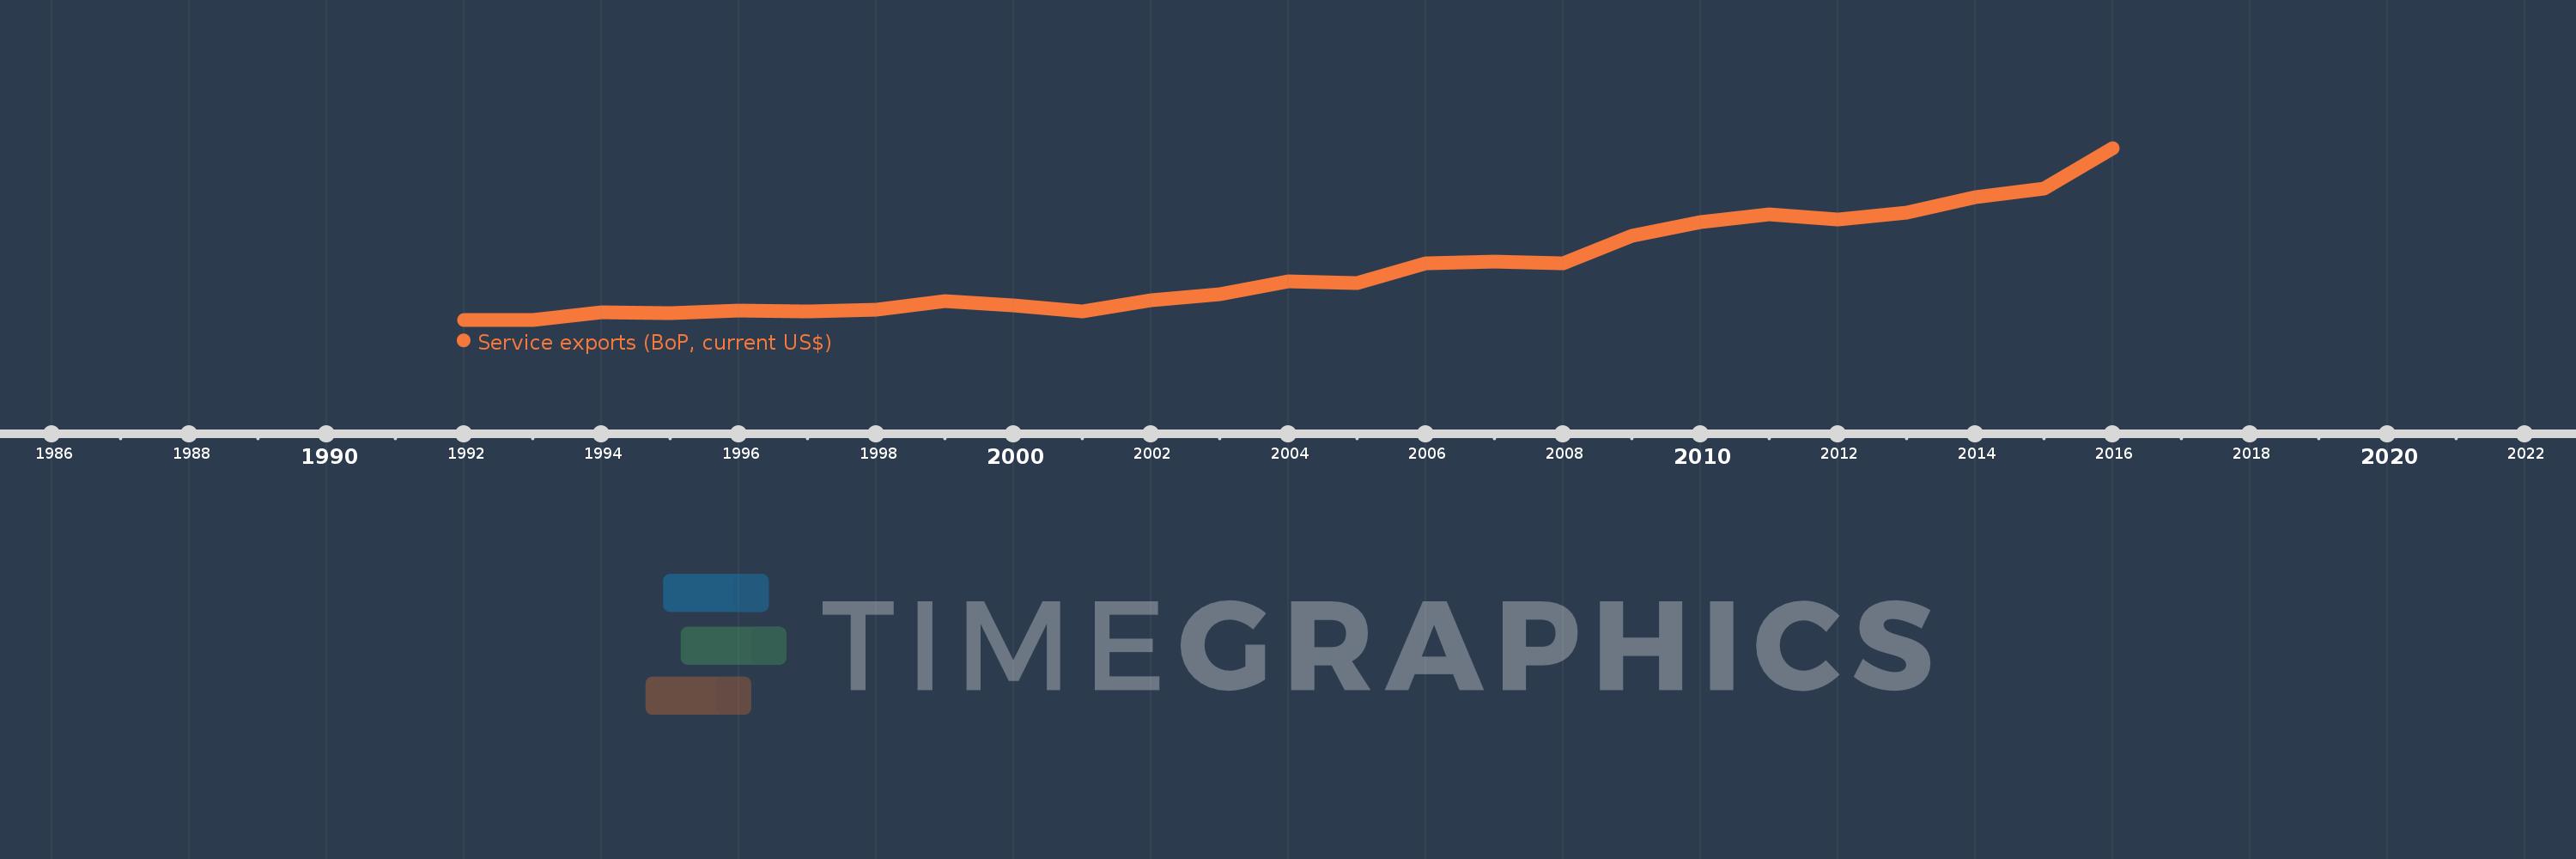
Cette échelle de temps montre un graphique de 1992 année à 2016 année Djibouti. Les données jusqu'à 1991 année ne sont pas présentés. Quantité d'observations actuelles selon dates: 25.

Source (désignation):

Les indicateurs du développement mondiale

Source (organisation):

International Monetary Fund, Balance of Payments Statistics Yearbook and data files.

Catégories:

Economy & Growth, Trade

Dernière mise à jour

23 avr. 2017

Les indicateurs de changement de valeurs selon les années

En moyenne:
239.516 mln.
Minimum:
146.516 mln.
1 janv. 1992
Maximum:
454.901 mln.
1 janv. 2016
Pour la date d''observation
Valeur
Changement absolu
Le changement par rapport à la valeur précédente
1 janv. 1992
146.516 mln.
+146.516 mln.
0.0%
1 janv. 1993
146.516 mln.
0.0
0.0%
1 janv. 1994
159.638 mln.
+13.122 mln.
8.96%
1 janv. 1995
158.518 mln.
-1.12 mln.
-0.7%
1 janv. 1996
162.823 mln.
+4.304 mln.
2.72%
1 janv. 1997
161.253 mln.
-1.57 mln.
-0.96%
1 janv. 1998
163.993 mln.
+2.74 mln.
1.7%
1 janv. 1999
180.007 mln.
+16.014 mln.
9.76%
1 janv. 2000
172.551 mln.
-7.456 mln.
-4.14%
1 janv. 2001
161.613 mln.
-10.938 mln.
-6.34%
1 janv. 2002
181.869 mln.
+20.256 mln.
12.53%
1 janv. 2003
192.38 mln.
+10.511 mln.
5.78%
1 janv. 2004
215.748 mln.
+23.368 mln.
12.15%
1 janv. 2005
212.749 mln.
-2.999 mln.
-1.39%
1 janv. 2006
248.367 mln.
+35.618 mln.
16.74%
1 janv. 2007
251.456 mln.
+3.089 mln.
1.24%
1 janv. 2008
248.474 mln.
-2.982 mln.
-1.19%
1 janv. 2009
296.887 mln.
+48.413 mln.
19.48%
1 janv. 2010
322.038 mln.
+25.152 mln.
8.47%
1 janv. 2011
335.74 mln.
+13.701 mln.
4.25%
1 janv. 2012
326.968 mln.
-8.772 mln.
-2.61%
1 janv. 2013
339.442 mln.
+12.475 mln.
3.82%
1 janv. 2014
365.849 mln.
+26.407 mln.
7.78%
1 janv. 2015
381.593 mln.
+15.744 mln.
4.3%
1 janv. 2016
454.901 mln.
+73.308 mln.
19.21%

Classement des pays selon les statistiques actuelles par années