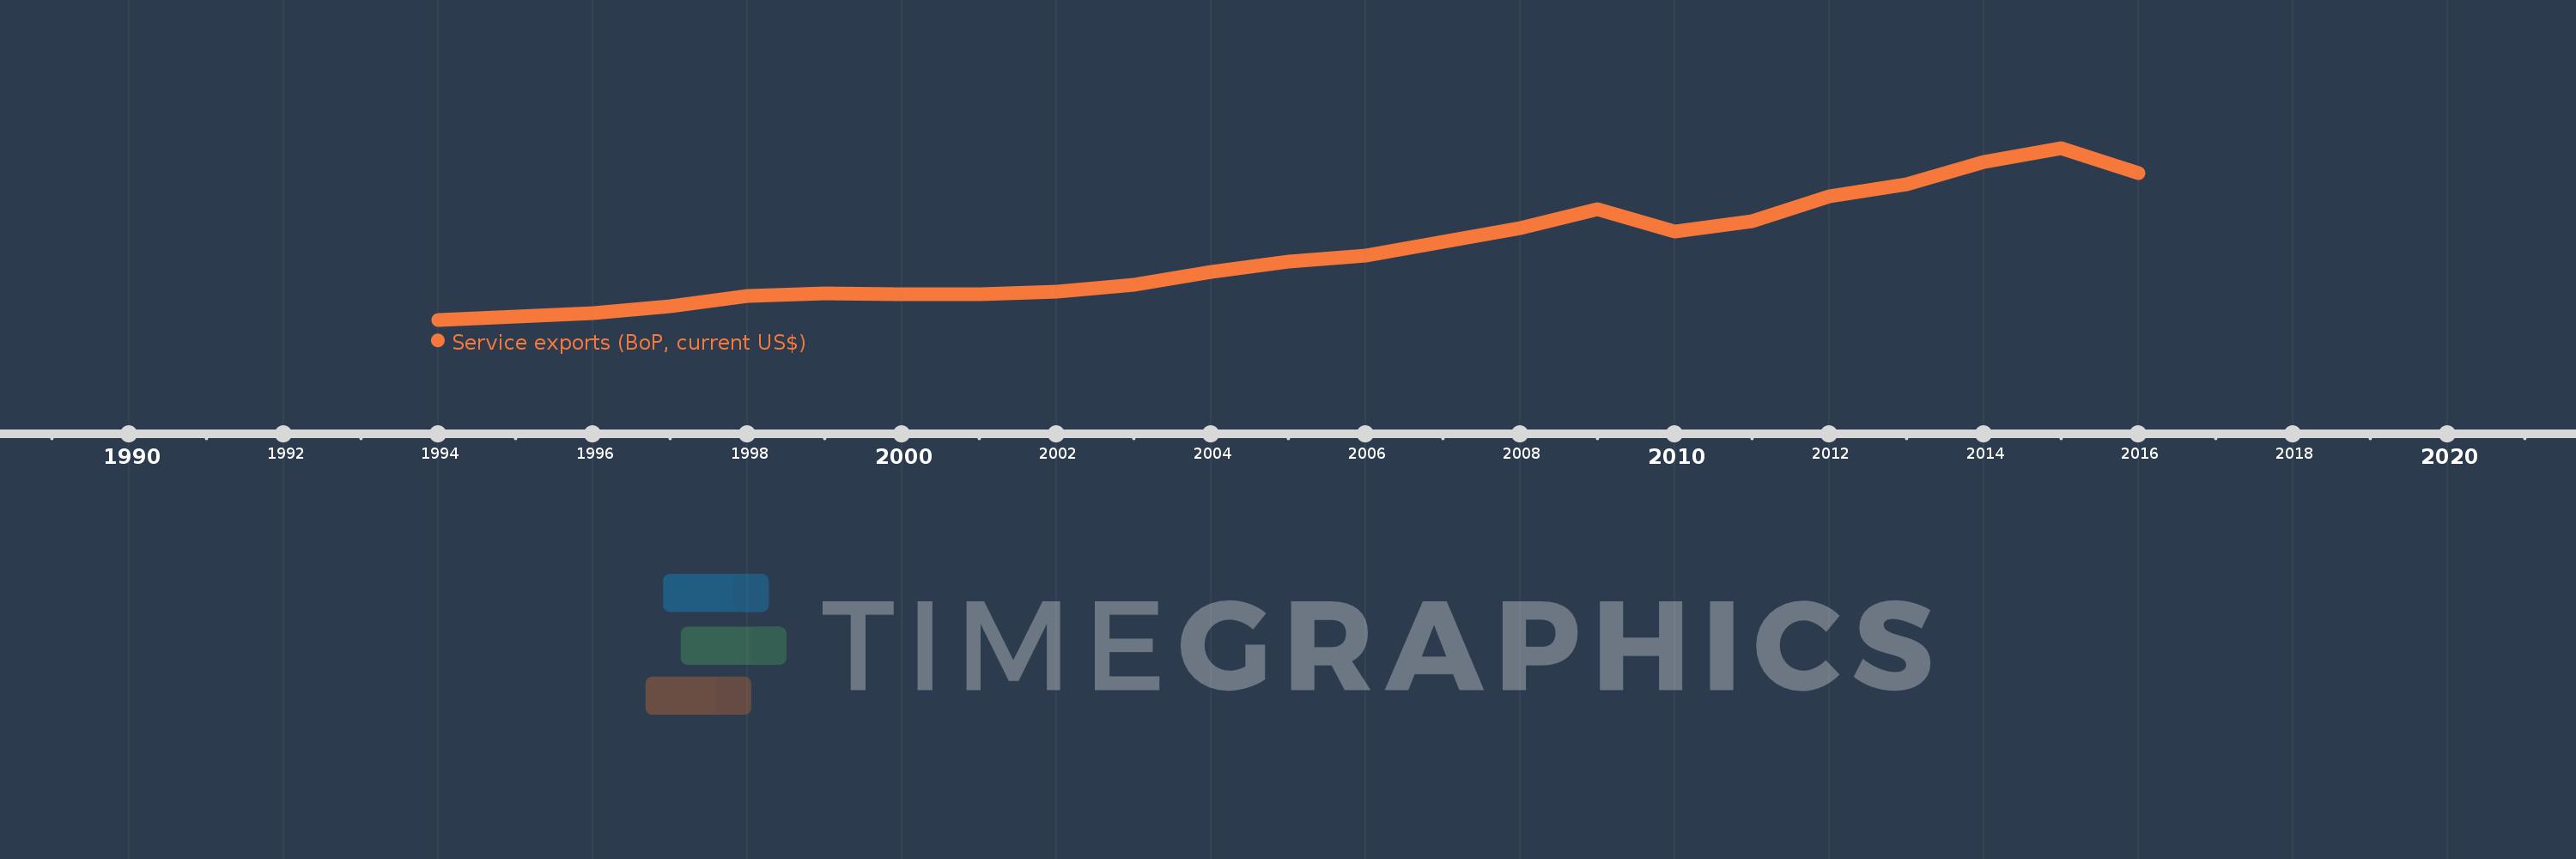
Cette échelle de temps montre un graphique de 1994 année à 2016 année Lithuania. Les données jusqu'à 1993 année ne sont pas présentés. Quantité d'observations actuelles selon dates: 23.
Source (désignation):
Les indicateurs du développement mondiale
Source (organisation):
International Monetary Fund, Balance of Payments Statistics Yearbook and data files.
Catégories:
Economy & Growth, Trade
Dernière mise à jour
23 avr. 2017
Les indicateurs de changement de valeurs selon les années
En moyenne:
3.185 mds
Minimum:
197.801 mln.
1 janv. 1994
Maximum:
7.762 mds
1 janv. 2015
Pour la date d''observation
Valeur
Changement absolu
Le changement par rapport à la valeur précédente
1 janv. 1994
197.801 mln.
+197.801 mln.
0.0%
1 janv. 1995
321.932 mln.
+124.131 mln.
62.76%
1 janv. 1996
485.217 mln.
+163.286 mln.
50.72%
1 janv. 1997
797.528 mln.
+312.31 mln.
64.36%
1 janv. 1998
1.232 mds
+434.582 mln.
54.49%
1 janv. 1999
1.353 mds
+120.49 mln.
9.78%
1 janv. 2000
1.328 mds
-24.585 mln.
-1.82%
1 janv. 2001
1.328 mds
-292.5 milles
-0.02%
1 janv. 2002
1.423 mds
+95.578 mln.
7.2%
1 janv. 2003
1.751 mds
+327.806 mln.
23.03%
1 janv. 2004
2.308 mds
+556.6 mln.
31.79%
1 janv. 2005
2.765 mds
+457.558 mln.
19.83%
1 janv. 2006
3.04 mds
+274.24 mln.
9.92%
1 janv. 2007
3.63 mds
+590.819 mln.
19.44%
1 janv. 2008
4.243 mds
+612.566 mln.
16.87%
1 janv. 2009
5.068 mds
+825.313 mln.
19.45%
1 janv. 2010
4.094 mds
-974.257 mln.
-19.22%
1 janv. 2011
4.525 mds
+431.307 mln.
10.54%
1 janv. 2012
5.621 mds
+1.096 mds
24.21%
1 janv. 2013
6.151 mds
+530.388 mln.
9.44%
1 janv. 2014
7.162 mds
+1.011 mds
16.43%
1 janv. 2015
7.762 mds
+599.856 mln.
8.38%
1 janv. 2016
6.663 mds
-1.099 mds
-14.16%
Classement des pays selon les statistiques actuelles par années