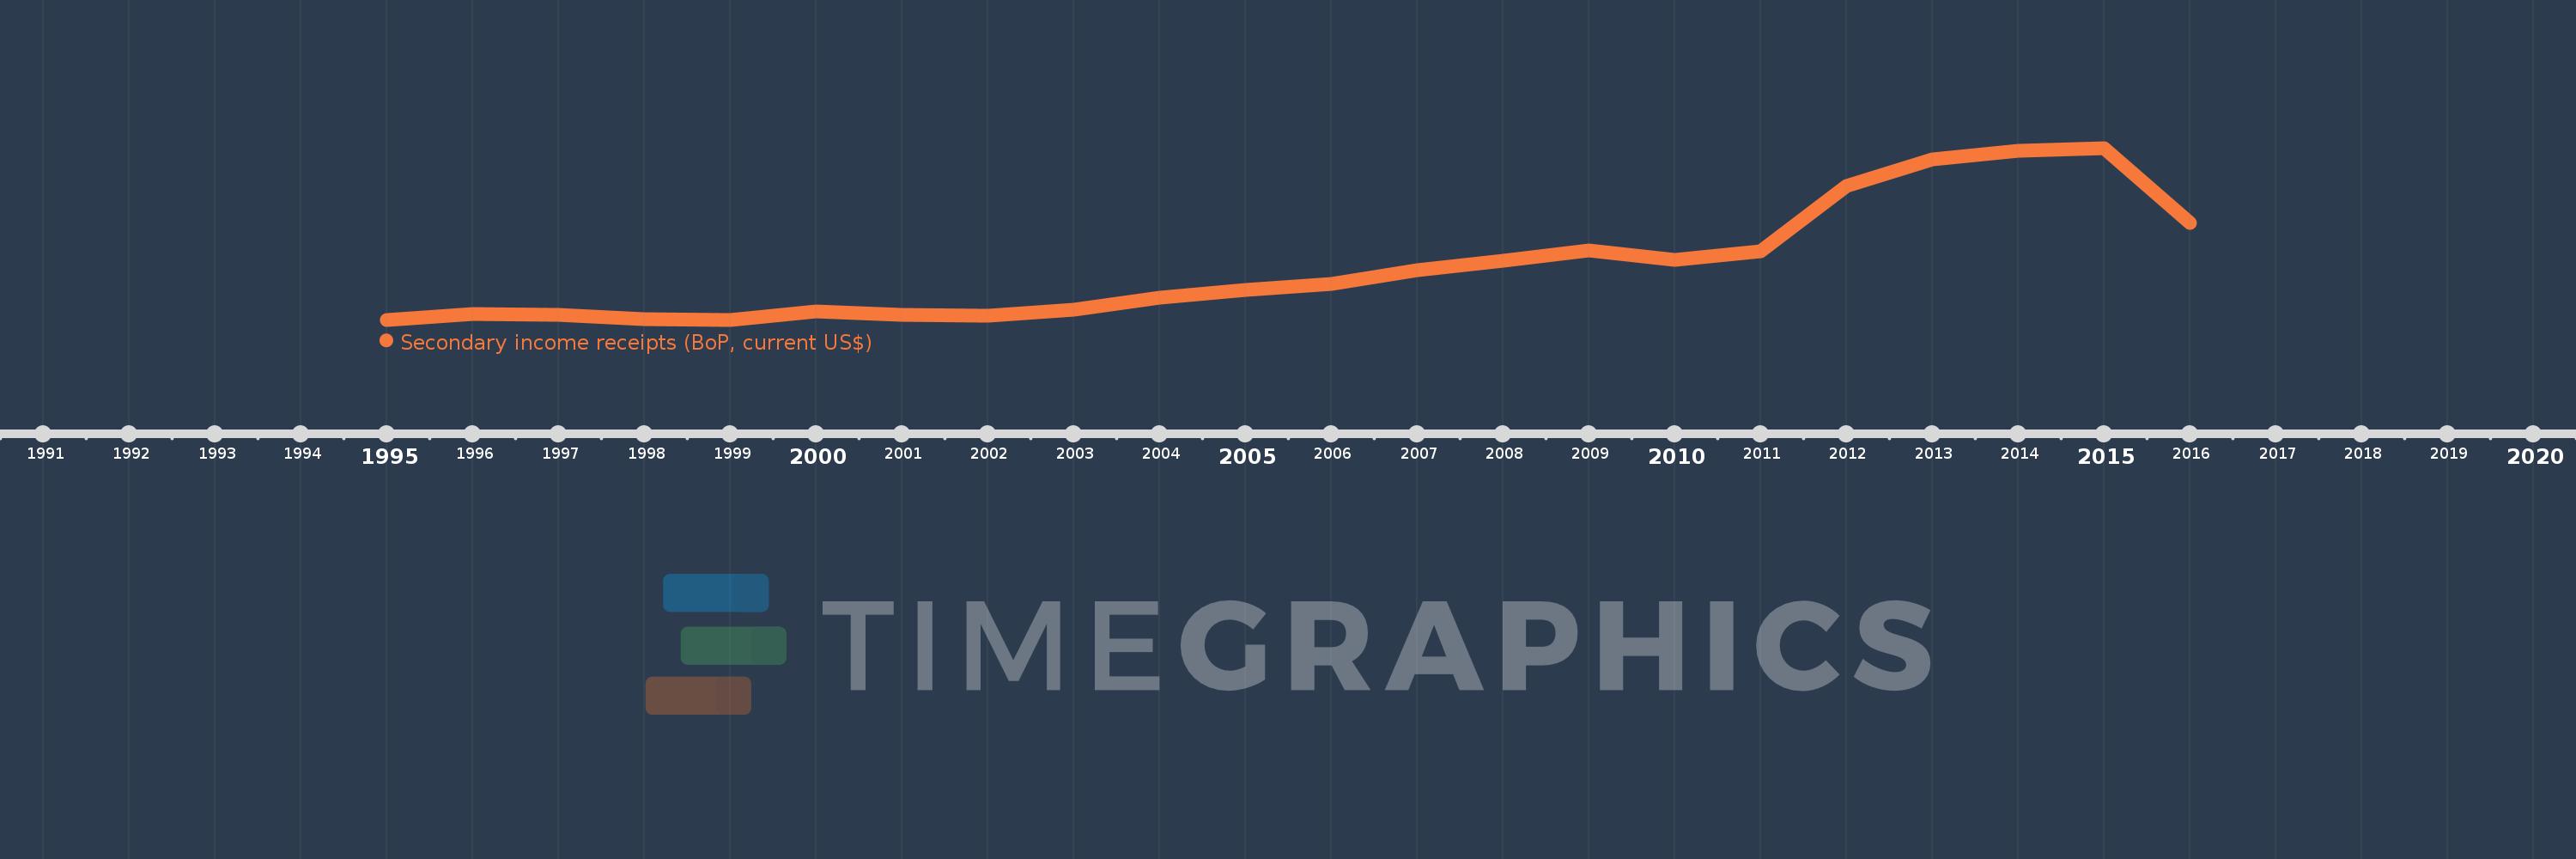
Cette échelle de temps montre un graphique de 1995 année à 2016 année Russian Federation. Les données jusqu'à 1994 année ne sont pas présentés. Quantité d'observations actuelles selon dates: 22.
Source (désignation):
Les indicateurs du développement mondiale
Source (organisation):
International Monetary Fund, Balance of Payments Statistics Yearbook and data files.
Catégories:
Economy & Growth
Dernière mise à jour
23 avr. 2017
Les indicateurs de changement de valeurs selon les années
En moyenne:
5.65 mds
Minimum:
307.57 mln.
1 janv. 1999
Maximum:
17.643 mds
1 janv. 2015
Pour la date d''observation
Valeur
Changement absolu
Le changement par rapport à la valeur précédente
1 janv. 1995
311.43 mln.
+311.43 mln.
0.0%
1 janv. 1996
894.235 mln.
+582.805 mln.
187.14%
1 janv. 1997
772.579 mln.
-121.656 mln.
-13.6%
1 janv. 1998
410.04 mln.
-362.539 mln.
-46.93%
1 janv. 1999
307.57 mln.
-102.47 mln.
-24.99%
1 janv. 2000
1.183 mds
+875.28 mln.
284.58%
1 janv. 2001
807.45 mln.
-375.4 mln.
-31.74%
1 janv. 2002
692.64 mln.
-114.81 mln.
-14.22%
1 janv. 2003
1.351 mds
+658.35 mln.
95.05%
1 janv. 2004
2.537 mds
+1.186 mds
87.79%
1 janv. 2005
3.316 mds
+778.52 mln.
30.69%
1 janv. 2006
3.884 mds
+568.24 mln.
17.14%
1 janv. 2007
5.318 mds
+1.435 mds
36.94%
1 janv. 2008
6.22 mds
+902.0 mln.
16.96%
1 janv. 2009
7.345 mds
+1.125 mds
18.08%
1 janv. 2010
6.369 mds
-976.35 mln.
-13.29%
1 janv. 2011
7.258 mds
+889.36 mln.
13.96%
1 janv. 2012
13.768 mds
+6.51 mds
89.69%
1 janv. 2013
16.459 mds
+2.69 mds
19.54%
1 janv. 2014
17.332 mds
+873.79 mln.
5.31%
1 janv. 2015
17.643 mds
+310.78 mln.
1.79%
1 janv. 2016
10.118 mds
-7.525 mds
-42.65%
Classement des pays selon les statistiques actuelles par années