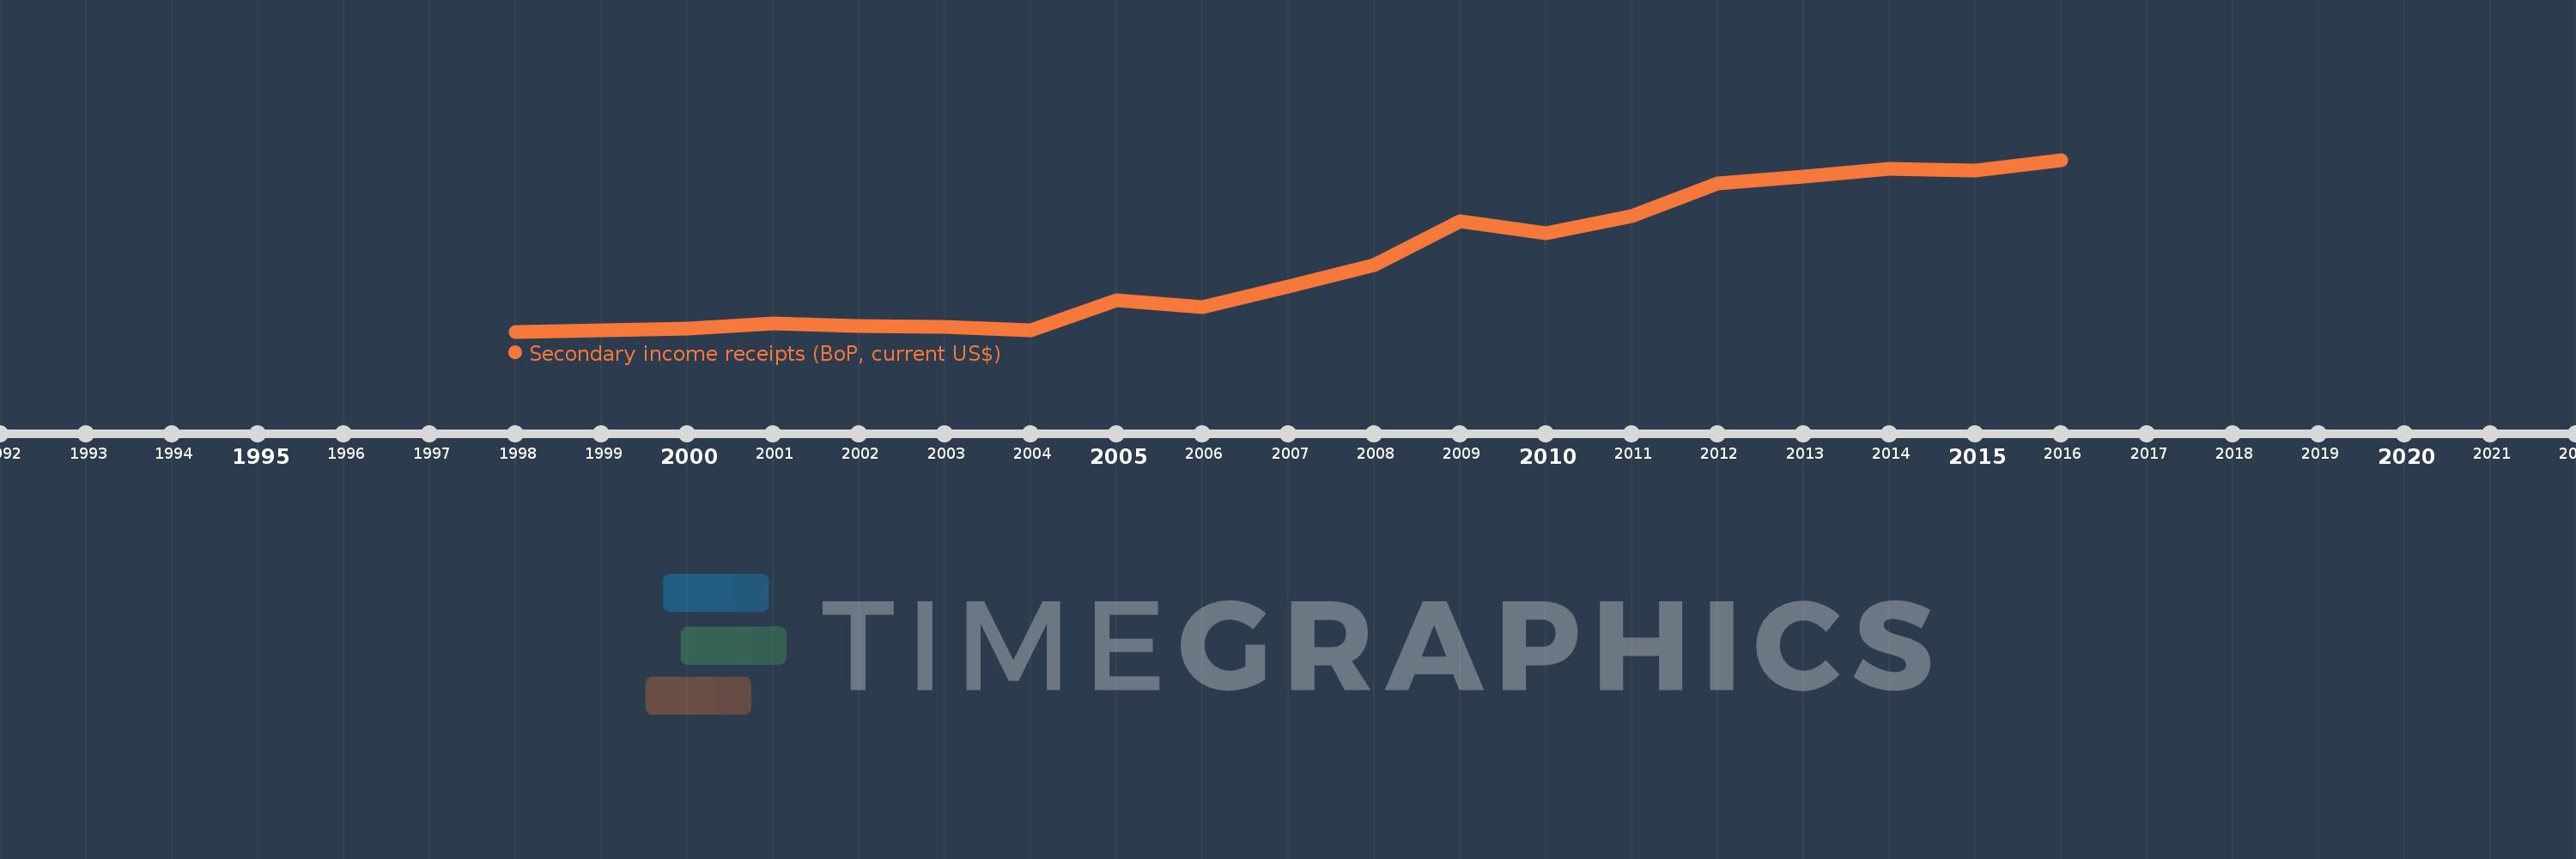
Cette échelle de temps montre un graphique de 1998 année à 2016 année Georgia. Les données jusqu'à 1997 année ne sont pas présentés. Quantité d'observations actuelles selon dates: 19.
Source (désignation):
Les indicateurs du développement mondiale
Source (organisation):
International Monetary Fund, Balance of Payments Statistics Yearbook and data files.
Catégories:
Economy & Growth
Dernière mise à jour
23 avr. 2017
Les indicateurs de changement de valeurs selon les années
En moyenne:
791.609 mln.
Minimum:
205.5 mln.
1 janv. 1998
Maximum:
1.66 mds
1 janv. 2016
Pour la date d''observation
Valeur
Changement absolu
Le changement par rapport à la valeur précédente
1 janv. 1998
205.5 mln.
+205.5 mln.
0.0%
1 janv. 1999
219.9 mln.
+14.4 mln.
7.01%
1 janv. 2000
228.7 mln.
+8.8 mln.
4.0%
1 janv. 2001
277.531 mln.
+48.831 mln.
21.35%
1 janv. 2002
256.315 mln.
-21.216 mln.
-7.64%
1 janv. 2003
245.599 mln.
-10.717 mln.
-4.18%
1 janv. 2004
217.86 mln.
-27.739 mln.
-11.29%
1 janv. 2005
467.731 mln.
+249.871 mln.
114.69%
1 janv. 2006
413.435 mln.
-54.296 mln.
-11.61%
1 janv. 2007
586.957 mln.
+173.522 mln.
41.97%
1 janv. 2008
768.456 mln.
+181.499 mln.
30.92%
1 janv. 2009
1.142 mds
+373.564 mln.
48.61%
1 janv. 2010
1.039 mds
-103.497 mln.
-9.06%
1 janv. 2011
1.183 mds
+144.913 mln.
13.95%
1 janv. 2012
1.459 mds
+275.101 mln.
23.25%
1 janv. 2013
1.516 mds
+57.314 mln.
3.93%
1 janv. 2014
1.585 mds
+68.743 mln.
4.53%
1 janv. 2015
1.569 mds
-15.231 mln.
-0.96%
1 janv. 2016
1.66 mds
+90.889 mln.
5.79%
Classement des pays selon les statistiques actuelles par années