30
/fr/
AIzaSyAYiBZKx7MnpbEhh9jyipgxe19OcubqV5w
April 1, 2024
129865
Estonia
EST
true
2
1
Secondary income receipts (BoP, current US$)
2016,2015,2014,2013,2012,2011,2010,2009,2008,2007,2006,2005,2004,2003,2002,2001,2000,1999,1998,1997,1996,1995,1994,1993
Download
Bibliothèque de statistiques globales →Estonia →

Secondary income receipts (BoP, current US$)

Cette statistique dans les autres pays:

AfghanistanAlbaniaAlgeriaAngolaAntigua and BarbudaArab WorldArgentinaArmeniaArubaAustraliaAustriaAzerbaijanBahamas, TheBahrainBangladeshBarbadosBelarusBelgiumBelizeBeninBermudaBhutanBoliviaBosnia and HerzegovinaBotswanaBrazilBrunei DarussalamBulgariaBurkina FasoBurundiCabo VerdeCambodiaCameroonCanadaCaribbean small statesCentral African RepublicCentral Europe and the BalticsChadChileChinaColombiaComorosCongo, Dem. Rep.Congo, Rep.Costa RicaCote d'IvoireCroatiaCuracaoCyprusCzech RepublicDenmarkDjiboutiDominicaDominican RepublicEarly-demographic dividendEast Asia & PacificEast Asia & Pacific (excluding high income)East Asia & Pacific (IDA & IBRD countries)EcuadorEgypt, Arab Rep.El SalvadorEquatorial GuineaEritreaEstoniaEthiopiaEuro areaEurope & Central AsiaEurope & Central Asia (excluding high income)Europe & Central Asia (IDA & IBRD countries)European UnionFaroe IslandsFijiFinlandFragile and conflict affected situationsFranceFrench PolynesiaGabonGambia, TheGeorgiaGermanyGhanaGreeceGrenadaGuatemalaGuineaGuinea-BissauGuyanaHaitiHeavily indebted poor countries (HIPC)High incomeHondurasHong Kong SAR, ChinaHungaryIBRD onlyIcelandIDA & IBRD totalIDA blendIDA onlyIDA totalIndiaIndonesiaIran, Islamic Rep.IraqIrelandIsraelItalyJamaicaJapanJordanKazakhstanKenyaKiribatiKorea, Rep.KosovoKuwaitKyrgyz RepublicLao PDRLate-demographic dividendLatin America & Caribbean Latin America & Caribbean (excluding high income)Latin America & the Caribbean (IDA & IBRD countries)LatviaLeast developed countries: UN classificationLebanonLesothoLiberiaLibyaLithuaniaLow & middle incomeLow incomeLower middle incomeLuxembourgMacao SAR, ChinaMacedonia, FYRMadagascarMalawiMalaysiaMaldivesMaliMaltaMarshall IslandsMauritaniaMauritiusMexicoMicronesia, Fed. Sts.Middle East & North AfricaMiddle East & North Africa (excluding high income)Middle East & North Africa (IDA & IBRD countries)Middle incomeMoldovaMongoliaMontenegroMoroccoMozambiqueMyanmarNamibiaNepalNetherlandsNew CaledoniaNew ZealandNicaraguaNigerNigeriaNorth AmericaNorwayOECD membersOmanOther small statesPacific island small statesPakistanPalauPanamaPapua New GuineaParaguayPeruPhilippinesPolandPortugalPost-demographic dividendPre-demographic dividendQatarRomaniaRussian FederationRwandaSamoaSao Tome and PrincipeSaudi ArabiaSenegalSerbiaSeychellesSierra LeoneSingaporeSint Maarten (Dutch part)Slovak RepublicSloveniaSmall statesSolomon IslandsSouth AfricaSouth AsiaSouth Asia (IDA & IBRD)South SudanSpainSri LankaSt. Kitts and NevisSt. LuciaSt. Vincent and the GrenadinesSub-Saharan Africa Sub-Saharan Africa (excluding high income)Sub-Saharan Africa (IDA & IBRD countries)SudanSurinameSwazilandSwedenSwitzerlandSyrian Arab RepublicTajikistanTanzaniaThailandTimor-LesteTogoTongaTrinidad and TobagoTunisiaTurkeyTuvaluUgandaUkraineUnited KingdomUnited StatesUpper middle incomeUruguayVanuatuVenezuela, RBVietnamWest Bank and GazaWorldYemen, Rep.ZambiaZimbabwe

La ligne de temps

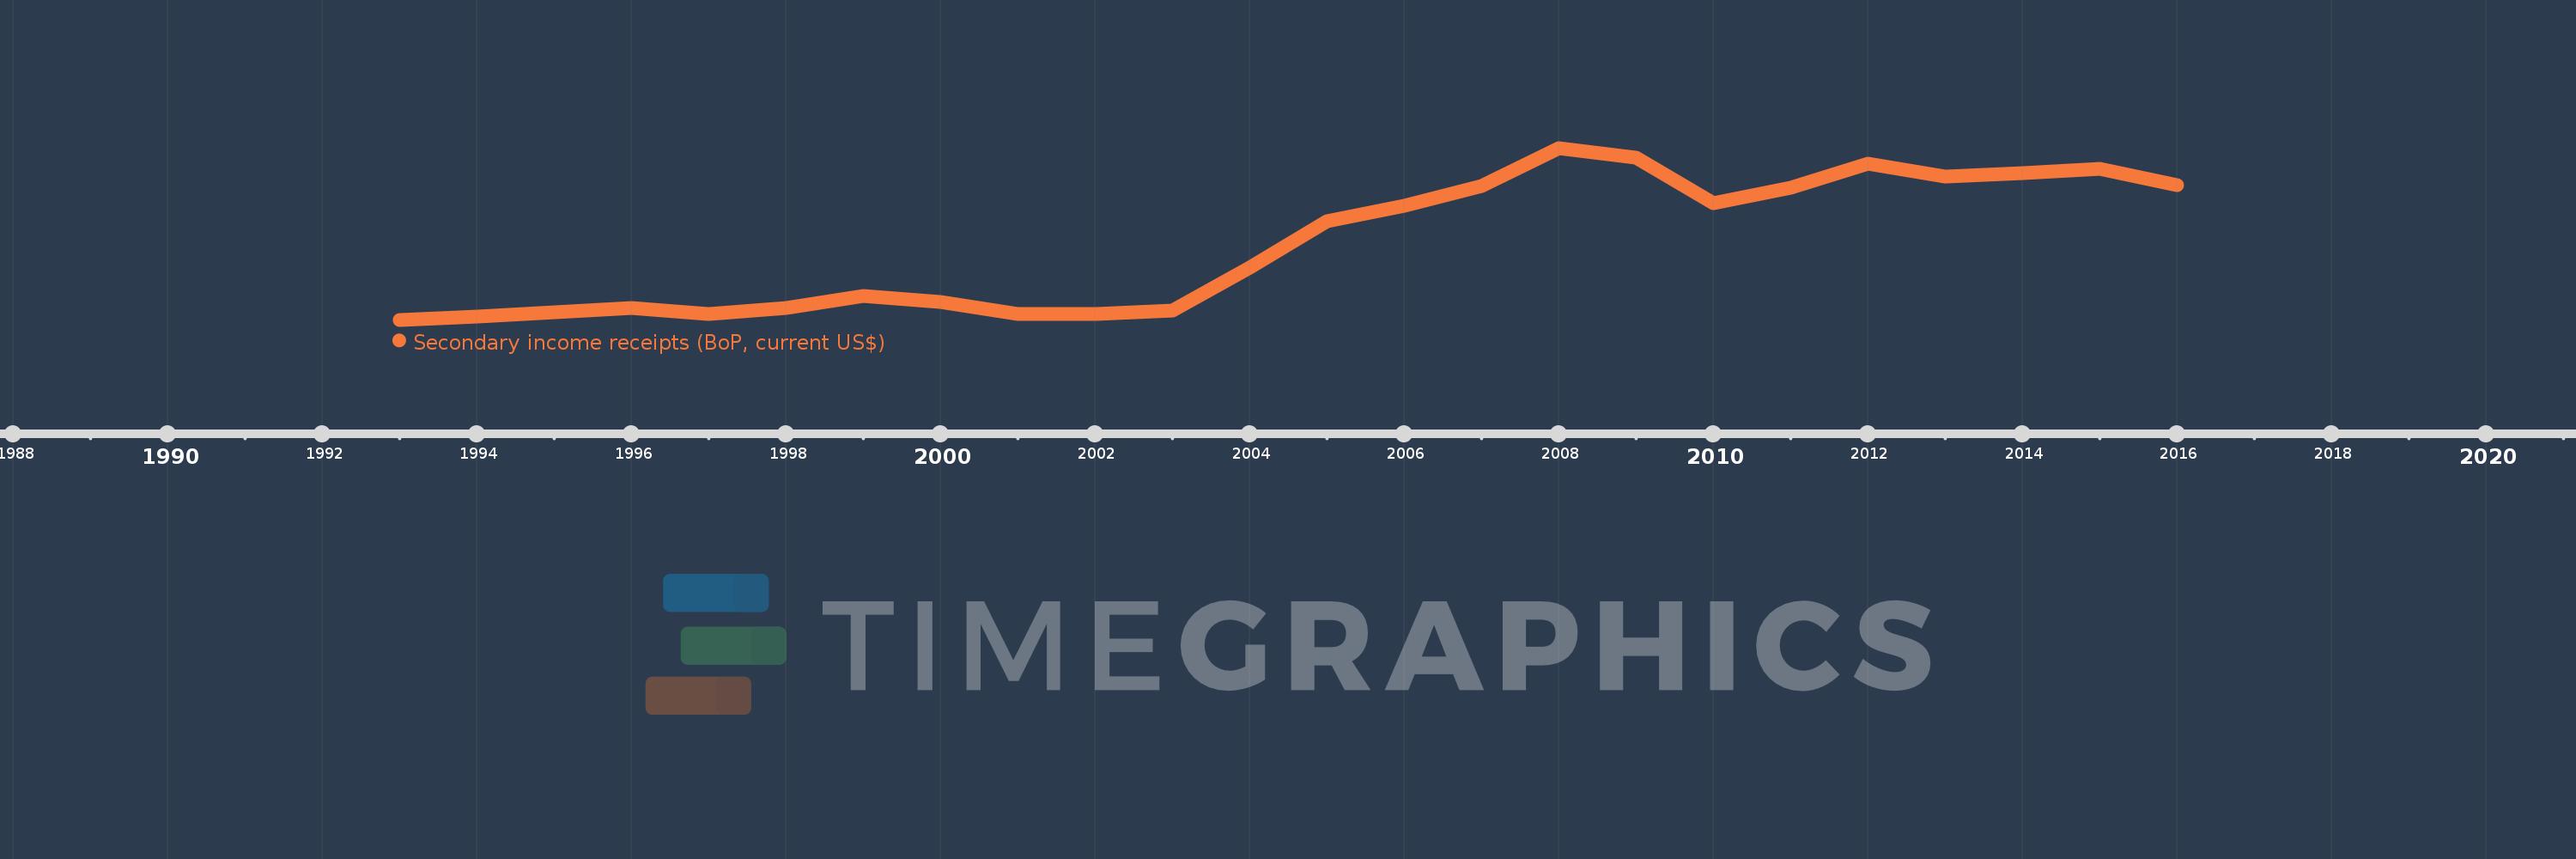
Cette échelle de temps montre un graphique de 1993 année à 2016 année Estonia. Les données jusqu'à 1992 année ne sont pas présentés. Quantité d'observations actuelles selon dates: 24.

Source (désignation):

Les indicateurs du développement mondiale

Source (organisation):

International Monetary Fund, Balance of Payments Statistics Yearbook and data files.

Catégories:

Economy & Growth

Dernière mise à jour

23 avr. 2017

Les indicateurs de changement de valeurs selon les années

En moyenne:
341.619 mln.
Minimum:
97.369 mln.
1 janv. 1993
Maximum:
652.686 mln.
1 janv. 2008
Pour la date d''observation
Valeur
Changement absolu
Le changement par rapport à la valeur précédente
1 janv. 1993
97.369 mln.
+97.369 mln.
0.0%
1 janv. 1994
108.44 mln.
+11.071 mln.
11.37%
1 janv. 1995
120.311 mln.
+11.872 mln.
10.95%
1 janv. 1996
134.499 mln.
+14.188 mln.
11.79%
1 janv. 1997
116.73 mln.
-17.769 mln.
-13.21%
1 janv. 1998
135.262 mln.
+18.532 mln.
15.88%
1 janv. 1999
172.938 mln.
+37.676 mln.
27.85%
1 janv. 2000
153.729 mln.
-19.209 mln.
-11.11%
1 janv. 2001
114.648 mln.
-39.081 mln.
-25.42%
1 janv. 2002
115.342 mln.
+694.212 milles
0.61%
1 janv. 2003
125.694 mln.
+10.352 mln.
8.98%
1 janv. 2004
266.463 mln.
+140.769 mln.
111.99%
1 janv. 2005
416.667 mln.
+150.204 mln.
56.37%
1 janv. 2006
465.626 mln.
+48.959 mln.
11.75%
1 janv. 2007
528.936 mln.
+63.309 mln.
13.6%
1 janv. 2008
652.686 mln.
+123.75 mln.
23.4%
1 janv. 2009
621.453 mln.
-31.233 mln.
-4.79%
1 janv. 2010
474.479 mln.
-146.974 mln.
-23.65%
1 janv. 2011
524.591 mln.
+50.112 mln.
10.56%
1 janv. 2012
602.717 mln.
+78.126 mln.
14.89%
1 janv. 2013
559.975 mln.
-42.742 mln.
-7.09%
1 janv. 2014
571.981 mln.
+12.006 mln.
2.14%
1 janv. 2015
586.348 mln.
+14.366 mln.
2.51%
1 janv. 2016
531.985 mln.
-54.363 mln.
-9.27%

Classement des pays selon les statistiques actuelles par années