29
/es/
es
AIzaSyAYiBZKx7MnpbEhh9jyipgxe19OcubqV5w
April 1, 2024
96245
Burundi
BDI
true
2
1
Imports of goods and services (constant LCU)
2016,2015,2014,2013,2012,2011,2010,2009,2008,2007,2006,2005,2004,2003,2002,2001,2000,1999,1998
Download
Estadísticas Globales de la Biblioteca →Burundi →

Imports of goods and services (constant LCU)

Estas estadísticas en otros países:
AlbaniaAlgeriaAngolaAntigua and BarbudaArgentinaArmeniaAustraliaAustriaAzerbaijanBahamas, TheBahrainBangladeshBarbadosBelarusBelgiumBelizeBeninBhutanBoliviaBosnia and HerzegovinaBotswanaBrazilBrunei DarussalamBulgariaBurkina FasoBurundiCabo VerdeCambodiaCameroonCanadaChadChileColombiaComorosCongo, Dem. Rep.Congo, Rep.Costa RicaCote d'IvoireCroatiaCubaCyprusCzech RepublicDenmarkDjiboutiDominican RepublicEcuadorEgypt, Arab Rep.El SalvadorEquatorial GuineaEritreaEstoniaEthiopiaFijiFinlandFranceGabonGambia, TheGeorgiaGermanyGhanaGreeceGuatemalaGuineaGuinea-BissauHaitiHondurasHong Kong SAR, ChinaHungaryIcelandIndiaIndonesiaIran, Islamic Rep.IrelandIsraelItalyJamaicaJapanJordanKazakhstanKenyaKorea, Rep.KosovoKuwaitKyrgyz RepublicLao PDRLatviaLebanonLiberiaLibyaLithuaniaLuxembourgMacao SAR, ChinaMacedonia, FYRMadagascarMalawiMalaysiaMaliMaltaMauritaniaMauritiusMexicoMoldovaMongoliaMontenegroMoroccoMozambiqueMyanmarNamibiaNepalNetherlandsNew ZealandNicaraguaNigerNigeriaNorwayOmanPakistanPanamaPapua New GuineaParaguayPeruPhilippinesPolandPortugalPuerto RicoQatarRomaniaRussian FederationRwandaSamoaSaudi ArabiaSenegalSerbiaSeychellesSierra LeoneSingaporeSlovak RepublicSloveniaSomaliaSouth AfricaSouth SudanSpainSri LankaSudanSurinameSwazilandSwedenSwitzerlandSyrian Arab RepublicTajikistanTanzaniaThailandTimor-LesteTogoTrinidad and TobagoTunisiaTurkeyTurkmenistanUgandaUkraineUnited Arab EmiratesUnited KingdomUnited StatesUruguayUzbekistanVanuatuVenezuela, RBVietnamWest Bank and GazaZambiaZimbabwe
línea de tiempo (timeline):
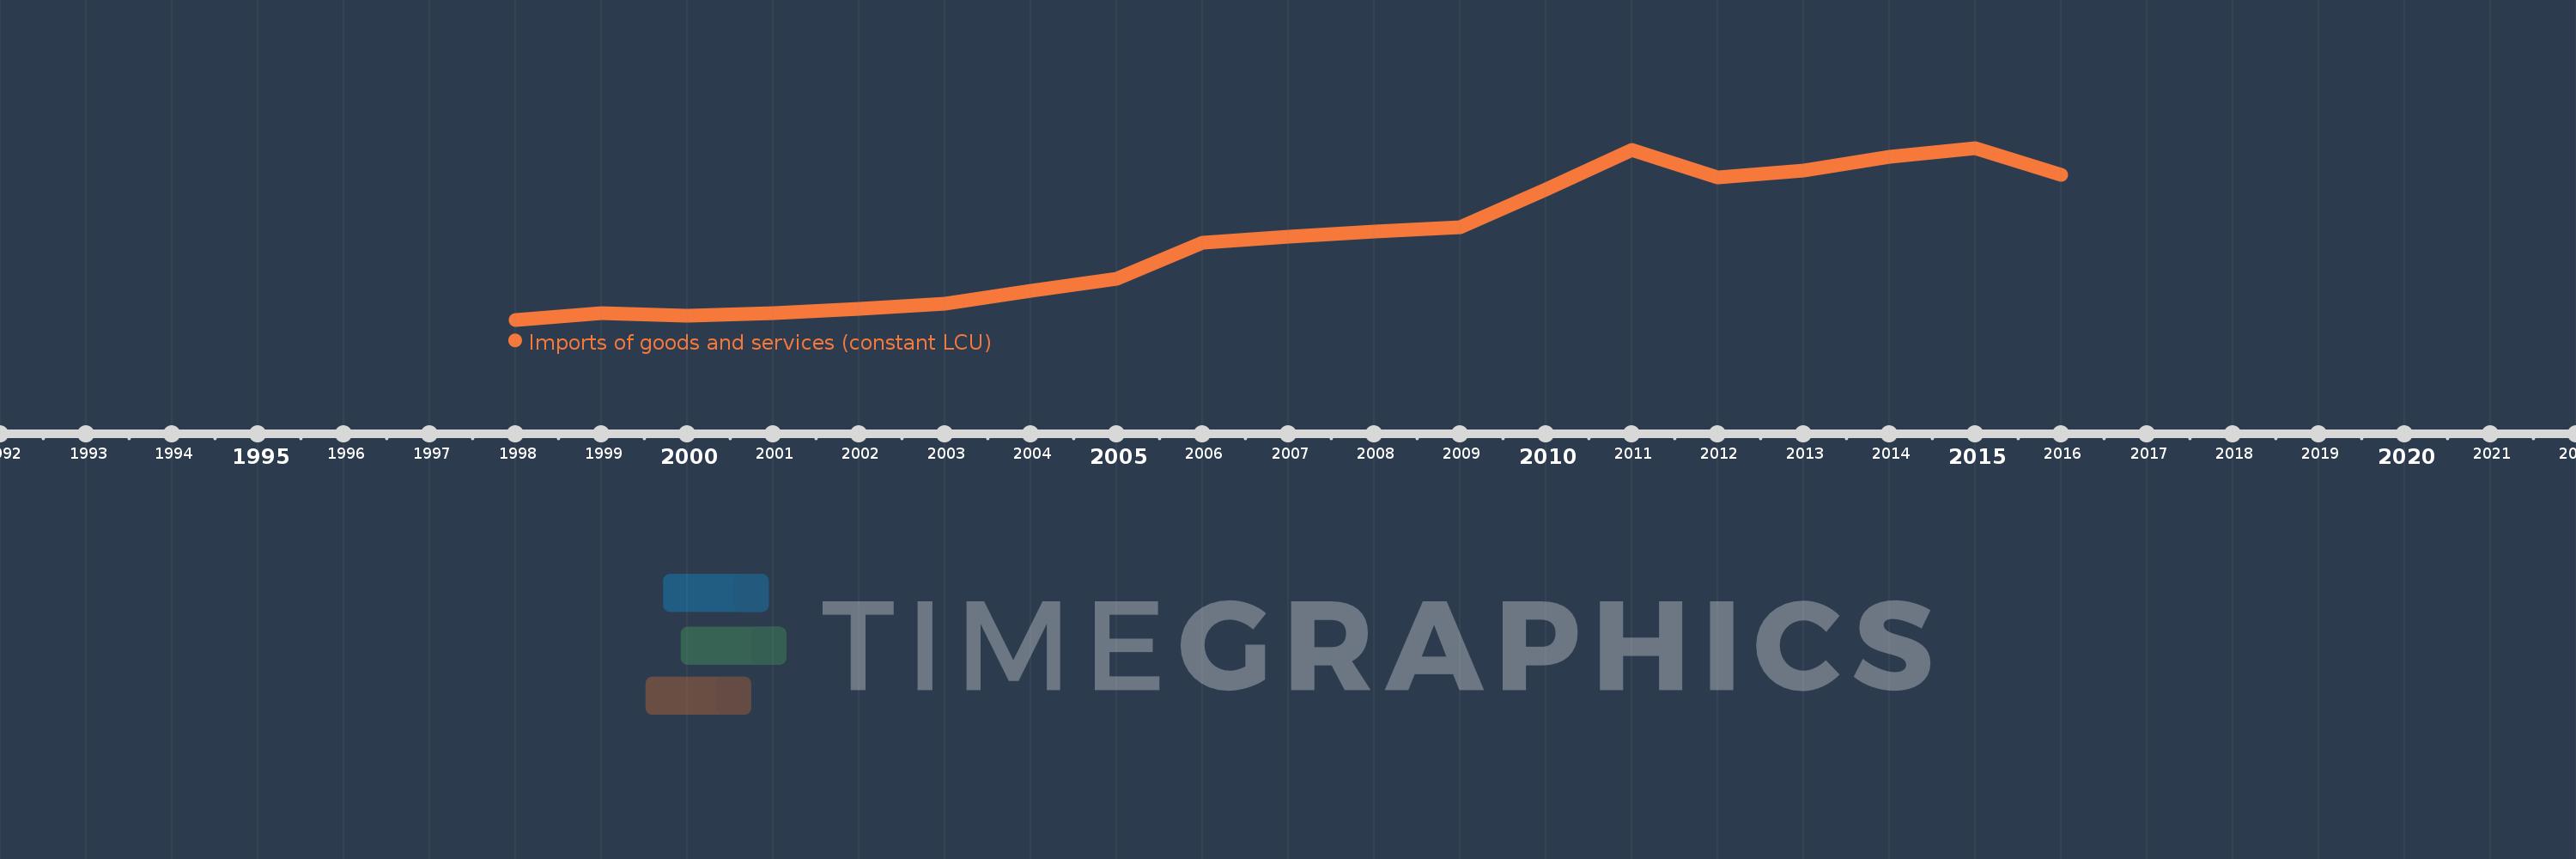
En esta escala de tiempo se presenta un gráfico de 1998 y 2016 de Burundi. Los datos de 1997 están ausentes. El número de observaciones reales por fecha: 19.
Fuente (nombre):
Indicadores del desarrollo mundial
Fuente (organización):
World Bank national accounts data, and OECD National Accounts data files.
Categorías:
Economy & Growth
Se ha actualizado:
23 abr 2017 año
Los indicadores de los cambios de valor en los últimos años
En promedio:
420.148 bn
Mínimo:
71.6 bn
1 ene 1998 año
Máximo:
817.16 bn
1 ene 2015 año
A la fecha de observación
Valor
Cambio absoluto
El cambio con respecto al valor anterior
1 ene 1998 año
71.6 bn
+71.6 bn
0.0%
1 ene 1999 año
99.3 bn
+27.7 bn
38.69%
1 ene 2000 año
90.5 bn
-8.8 bn
-8.86%
1 ene 2001 año
101.928 bn
+11.428 bn
12.63%
1 ene 2002 año
119.374 bn
+17.446 bn
17.12%
1 ene 2003 año
139.826 bn
+20.452 bn
17.13%
1 ene 2004 año
196.581 bn
+56.755 bn
40.59%
1 ene 2005 año
249.916 bn
+53.335 bn
27.13%
1 ene 2006 año
404.141 bn
+154.225 bn
61.71%
1 ene 2007 año
431.038 bn
+26.897 bn
6.66%
1 ene 2008 año
452.59 bn
+21.552 bn
5.0%
1 ene 2009 año
473.841 bn
+21.251 bn
4.7%
1 ene 2010 año
638.316 bn
+164.475 bn
34.71%
1 ene 2011 año
806.776 bn
+168.46 bn
26.39%
1 ene 2012 año
689.14 bn
-117.636 bn
-14.58%
1 ene 2013 año
720.6 bn
+31.46 bn
4.57%
1 ene 2014 año
778.248 bn
+57.648 bn
8.0%
1 ene 2015 año
817.16 bn
+38.912 bn
5.0%
1 ene 2016 año
701.941 bn
-115.22 bn
-14.1%
Ranking de los países por los datos estadísticos actuales

Comentarios:

Enviar
PremiumAbout & FeedbackAcuerdoPrivacidad
logo
© 2022 Selected Technologies LLC – Morgan Hill, California