29
/es/
es
AIzaSyAYiBZKx7MnpbEhh9jyipgxe19OcubqV5w
April 1, 2024
160605
Israel
ISR
true
2
1
Imports of goods and services (constant LCU)
2016,2015,2014,2013,2012,2011,2010,2009,2008,2007,2006,2005,2004,2003,2002,2001,2000,1999,1998,1997,1996
Download
Estadísticas Globales de la Biblioteca →Israel →

Imports of goods and services (constant LCU)

Estas estadísticas en otros países:
AlbaniaAlgeriaAngolaAntigua and BarbudaArgentinaArmeniaAustraliaAustriaAzerbaijanBahamas, TheBahrainBangladeshBarbadosBelarusBelgiumBelizeBeninBhutanBoliviaBosnia and HerzegovinaBotswanaBrazilBrunei DarussalamBulgariaBurkina FasoBurundiCabo VerdeCambodiaCameroonCanadaChadChileColombiaComorosCongo, Dem. Rep.Congo, Rep.Costa RicaCote d'IvoireCroatiaCubaCyprusCzech RepublicDenmarkDjiboutiDominican RepublicEcuadorEgypt, Arab Rep.El SalvadorEquatorial GuineaEritreaEstoniaEthiopiaFijiFinlandFranceGabonGambia, TheGeorgiaGermanyGhanaGreeceGuatemalaGuineaGuinea-BissauHaitiHondurasHong Kong SAR, ChinaHungaryIcelandIndiaIndonesiaIran, Islamic Rep.IrelandIsraelItalyJamaicaJapanJordanKazakhstanKenyaKorea, Rep.KosovoKuwaitKyrgyz RepublicLao PDRLatviaLebanonLiberiaLibyaLithuaniaLuxembourgMacao SAR, ChinaMacedonia, FYRMadagascarMalawiMalaysiaMaliMaltaMauritaniaMauritiusMexicoMoldovaMongoliaMontenegroMoroccoMozambiqueMyanmarNamibiaNepalNetherlandsNew ZealandNicaraguaNigerNigeriaNorwayOmanPakistanPanamaPapua New GuineaParaguayPeruPhilippinesPolandPortugalPuerto RicoQatarRomaniaRussian FederationRwandaSamoaSaudi ArabiaSenegalSerbiaSeychellesSierra LeoneSingaporeSlovak RepublicSloveniaSomaliaSouth AfricaSouth SudanSpainSri LankaSudanSurinameSwazilandSwedenSwitzerlandSyrian Arab RepublicTajikistanTanzaniaThailandTimor-LesteTogoTrinidad and TobagoTunisiaTurkeyTurkmenistanUgandaUkraineUnited Arab EmiratesUnited KingdomUnited StatesUruguayUzbekistanVanuatuVenezuela, RBVietnamWest Bank and GazaZambiaZimbabwe
línea de tiempo (timeline):
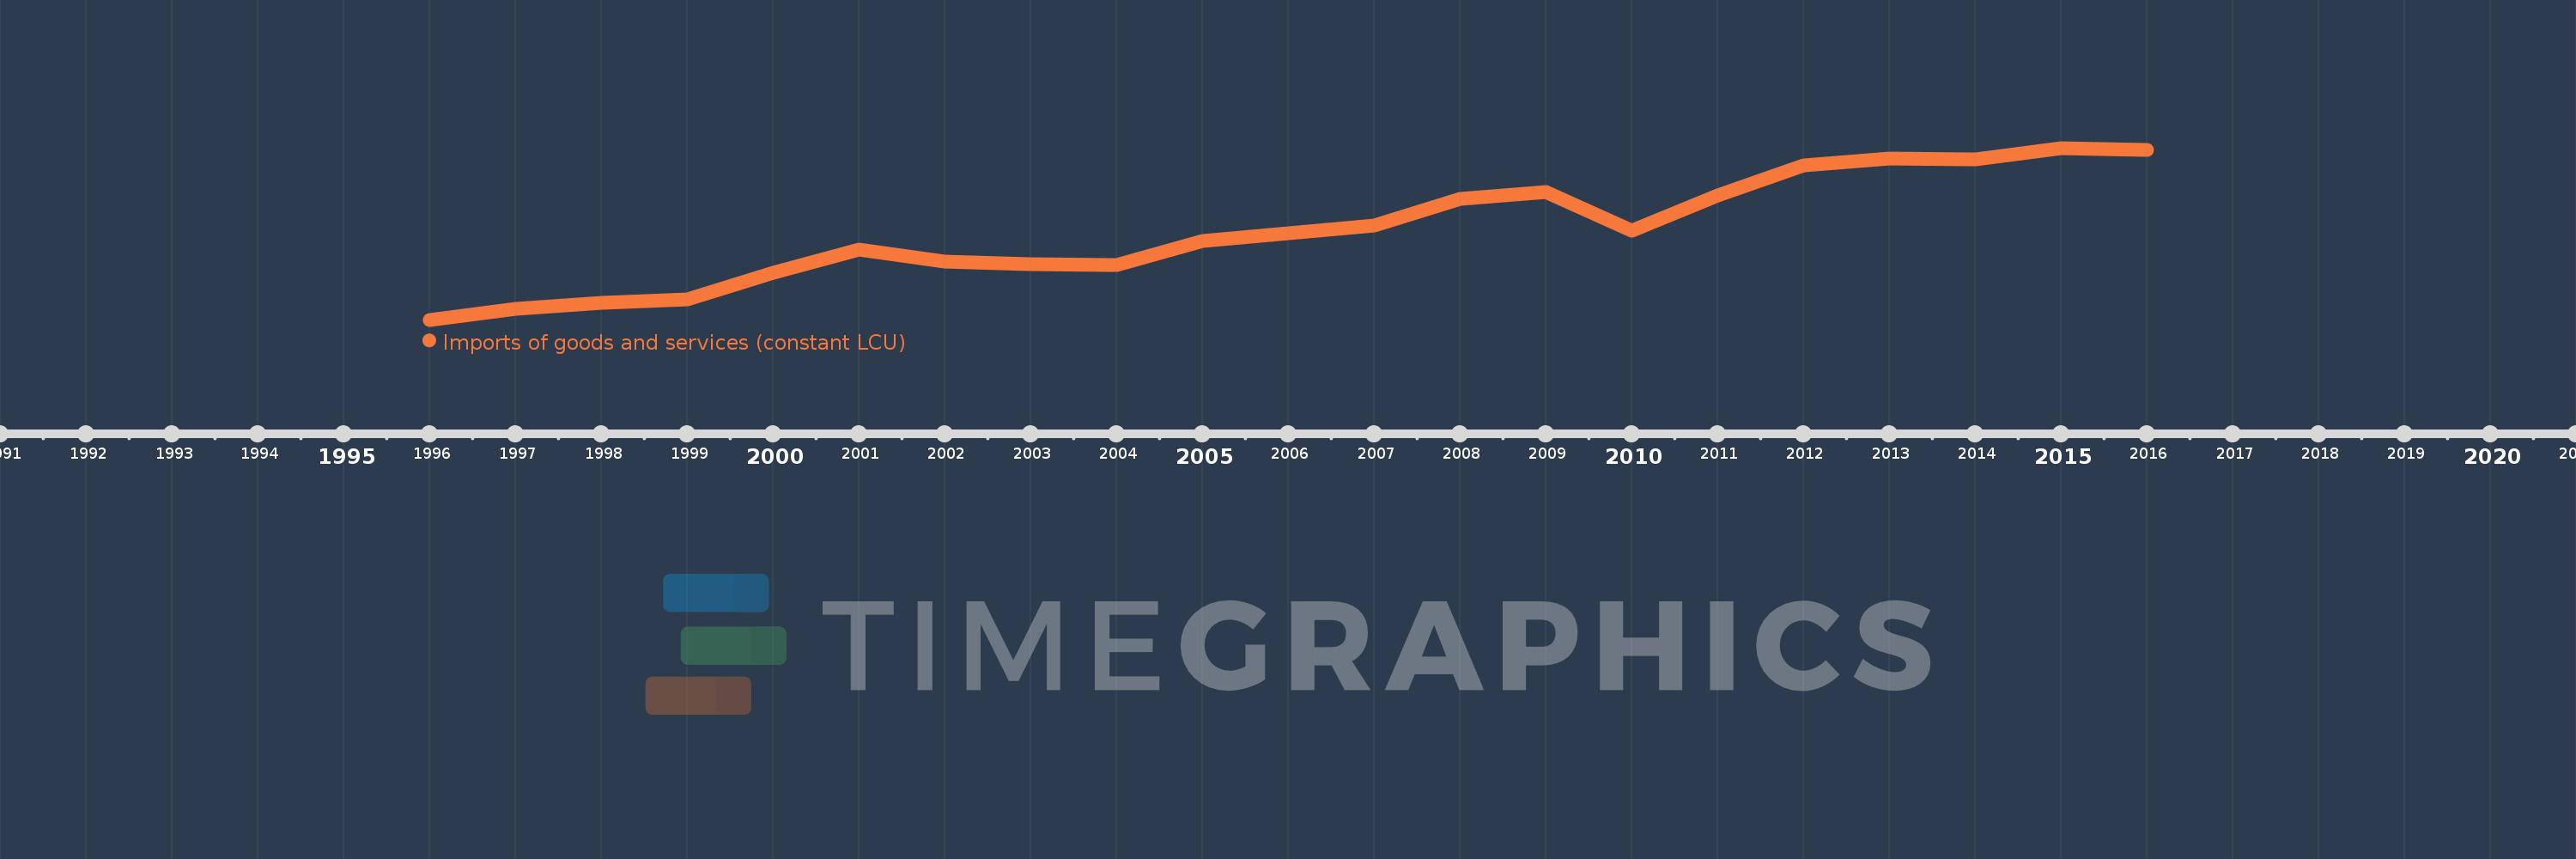
En esta escala de tiempo se presenta un gráfico de 1996 y 2016 de Israel. Los datos de 1995 están ausentes. El número de observaciones reales por fecha: 21.
Fuente (nombre):
Indicadores del desarrollo mundial
Fuente (organización):
World Bank national accounts data, and OECD National Accounts data files.
Categorías:
Economy & Growth
Se ha actualizado:
23 abr 2017 año
Los indicadores de los cambios de valor en los últimos años
En promedio:
250.082 bn
Mínimo:
155.993 bn
1 ene 1996 año
Máximo:
337.192 bn
1 ene 2015 año
A la fecha de observación
Valor
Cambio absoluto
El cambio con respecto al valor anterior
1 ene 1996 año
155.993 bn
+155.993 bn
0.0%
1 ene 1997 año
167.2 bn
+11.207 bn
7.18%
1 ene 1998 año
174.211 bn
+7.011 bn
4.19%
1 ene 1999 año
177.888 bn
+3.678 bn
2.11%
1 ene 2000 año
205.583 bn
+27.695 bn
15.57%
1 ene 2001 año
230.176 bn
+24.592 bn
11.96%
1 ene 2002 año
217.55 bn
-12.625 bn
-5.49%
1 ene 2003 año
214.907 bn
-2.643 bn
-1.21%
1 ene 2004 año
213.373 bn
-1.535 bn
-0.71%
1 ene 2005 año
238.719 bn
+25.347 bn
11.88%
1 ene 2006 año
247.162 bn
+8.443 bn
3.54%
1 ene 2007 año
255.331 bn
+8.169 bn
3.31%
1 ene 2008 año
283.523 bn
+28.192 bn
11.04%
1 ene 2009 año
290.454 bn
+6.931 bn
2.44%
1 ene 2010 año
249.931 bn
-40.523 bn
-13.95%
1 ene 2011 año
287.459 bn
+37.528 bn
15.02%
1 ene 2012 año
319.064 bn
+31.605 bn
10.99%
1 ene 2013 año
325.784 bn
+6.72 bn
2.11%
1 ene 2014 año
324.709 bn
-1.075 bn
-0.33%
1 ene 2015 año
337.192 bn
+12.483 bn
3.84%
1 ene 2016 año
335.504 bn
-1.688 bn
-0.5%
Ranking de los países por los datos estadísticos actuales

Comentarios:

Enviar
PremiumAbout & FeedbackAcuerdoPrivacidad
logo
© 2022 Selected Technologies LLC – Morgan Hill, California