29
/es/
es
AIzaSyAYiBZKx7MnpbEhh9jyipgxe19OcubqV5w
April 1, 2024
93388
Bulgaria
BGR
true
2
1
Current education expenditure, total (% of total expenditure in public institutions)
2013,2012,2011,2010,2009,2008,2007,2006,2004,2003,2002
Download
Estadísticas Globales de la Biblioteca →Bulgaria →

Current education expenditure, total (% of total expenditure in public institutions)

Estas estadísticas en otros países:
AfghanistanAlbaniaAmerican SamoaAndorraAngolaAntigua and BarbudaArgentinaArmeniaArubaAustraliaAustriaAzerbaijanBahrainBangladeshBarbadosBelarusBelgiumBelizeBeninBoliviaBotswanaBrazilBritish Virgin IslandsBulgariaBurkina FasoBurundiCabo VerdeCameroonCanadaCaribbean small statesCayman IslandsCentral African RepublicCentral Europe and the BalticsChadChileChinaColombiaComorosCongo, Dem. Rep.Costa RicaCote d'IvoireCroatiaCubaCuracaoCyprusCzech RepublicDenmarkDjiboutiDominicaDominican RepublicEcuadorEl SalvadorEritreaEstoniaEthiopiaEuro areaEurope & Central AsiaEurope & Central Asia (excluding high income)Europe & Central Asia (IDA & IBRD countries)European UnionFijiFinlandFranceGambia, TheGermanyGhanaGreeceGrenadaGuatemalaGuineaGuinea-BissauGuyanaHeavily indebted poor countries (HIPC)High incomeHondurasHong Kong SAR, ChinaHungaryIcelandIndiaIndonesiaIran, Islamic Rep.IrelandIsraelItalyJamaicaJapanJordanKazakhstanKorea, Rep.KuwaitKyrgyz RepublicLate-demographic dividendLatin America & Caribbean Latin America & Caribbean (excluding high income)Latin America & the Caribbean (IDA & IBRD countries)LatviaLebanonLesothoLiberiaLiechtensteinLithuaniaLow incomeLuxembourgMacao SAR, ChinaMacedonia, FYRMadagascarMalawiMalaysiaMaldivesMaliMaltaMarshall IslandsMauritiusMexicoMoldovaMonacoMongoliaMoroccoMozambiqueNamibiaNetherlandsNicaraguaNigerNorth AmericaNorwayOECD membersOmanPakistanPanamaParaguayPeruPhilippinesPolandPortugalPost-demographic dividendPuerto RicoQatarRomaniaRussian FederationRwandaSan MarinoSenegalSerbiaSeychellesSierra LeoneSingaporeSlovak RepublicSloveniaSouth AfricaSpainSri LankaSt. Kitts and NevisSt. LuciaSt. Vincent and the GrenadinesSwedenSwitzerlandTajikistanThailandTimor-LesteTogoTunisiaTurkeyTurkmenistanTurks and Caicos IslandsUgandaUkraineUnited KingdomUnited StatesUruguayVanuatuVenezuela, RBVietnamWest Bank and GazaYemen, Rep.Zambia
línea de tiempo (timeline):
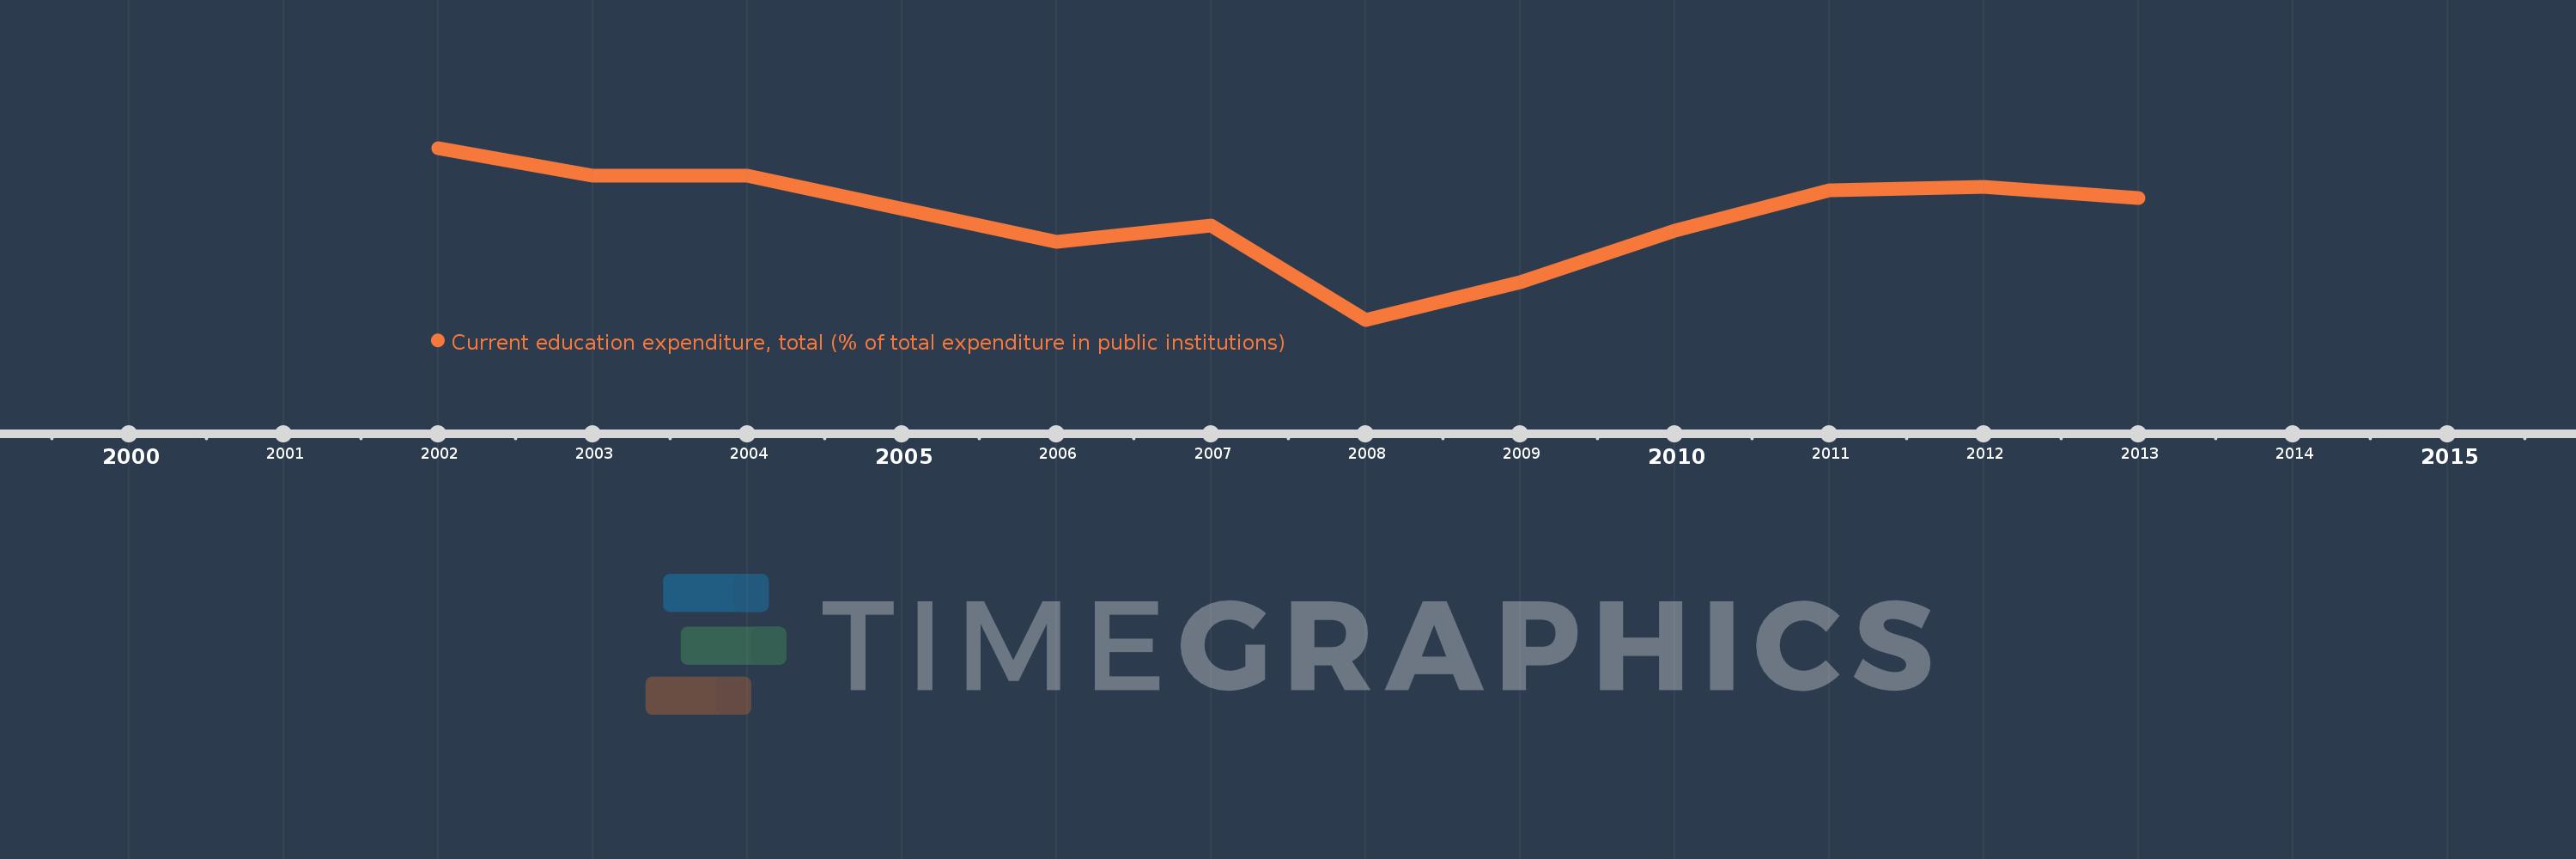
En esta escala de tiempo se presenta un gráfico de 2002 y 2013 de Bulgaria. Los datos de 2001 están ausentes. El número de observaciones reales por fecha: 11.
Fuente (nombre):
Indicadores del desarrollo mundial
Fuente (organización):
United Nations Educational, Scientific, and Cultural Organization (UNESCO) Institute for Statistics.
Categorías:
Education
Se ha actualizado:
23 abr 2017 año
Los indicadores de los cambios de valor en los últimos años
En promedio:
92.428
Mínimo:
82.408
1 ene 2008 año
Máximo:
98.979
1 ene 2002 año
A la fecha de observación
Valor
Cambio absoluto
El cambio con respecto al valor anterior
1 ene 2002 año
98.979
+98.979
0.0%
1 ene 2003 año
96.286
-2.693
-2.72%
1 ene 2004 año
96.323
+0.037
0.04%
1 ene 2006 año
89.89
-6.434
-6.68%
1 ene 2007 año
91.5
+1.61
1.79%
1 ene 2008 año
82.408
-9.092
-9.94%
1 ene 2009 año
86.028
+3.62
4.39%
1 ene 2010 año
90.998
+4.97
5.78%
1 ene 2011 año
94.931
+3.933
4.32%
1 ene 2012 año
95.229
+0.297
0.31%
1 ene 2013 año
94.138
-1.09
-1.14%
Ranking de los países por los datos estadísticos actuales

Comentarios:

Enviar
PremiumAbout & FeedbackAcuerdoPrivacidad
logo
© 2022 Selected Technologies LLC – Morgan Hill, California