33
/es/
AIzaSyAYiBZKx7MnpbEhh9jyipgxe19OcubqV5w
August 1, 2025
228292
Romania
ROU
true
2
1
Current education expenditure, total (% of total expenditure in public institutions)
2013,2012,2011,2010,2008,2006,2005,2004,2003,2002,1999
Download
Estadísticas Globales de la Biblioteca →Romania →

Current education expenditure, total (% of total expenditure in public institutions)

Estas estadísticas en otros países:

AfghanistanAlbaniaAmerican SamoaAndorraAngolaAntigua and BarbudaArgentinaArmeniaArubaAustraliaAustriaAzerbaijanBahrainBangladeshBarbadosBelarusBelgiumBelizeBeninBoliviaBotswanaBrazilBritish Virgin IslandsBulgariaBurkina FasoBurundiCabo VerdeCameroonCanadaCaribbean small statesCayman IslandsCentral African RepublicCentral Europe and the BalticsChadChileChinaColombiaComorosCongo, Dem. Rep.Costa RicaCote d'IvoireCroatiaCubaCuracaoCyprusCzech RepublicDenmarkDjiboutiDominicaDominican RepublicEcuadorEl SalvadorEritreaEstoniaEthiopiaEuro areaEurope & Central AsiaEurope & Central Asia (excluding high income)Europe & Central Asia (IDA & IBRD countries)European UnionFijiFinlandFranceGambia, TheGermanyGhanaGreeceGrenadaGuatemalaGuineaGuinea-BissauGuyanaHeavily indebted poor countries (HIPC)High incomeHondurasHong Kong SAR, ChinaHungaryIcelandIndiaIndonesiaIran, Islamic Rep.IrelandIsraelItalyJamaicaJapanJordanKazakhstanKorea, Rep.KuwaitKyrgyz RepublicLate-demographic dividendLatin America & Caribbean Latin America & Caribbean (excluding high income)Latin America & the Caribbean (IDA & IBRD countries)LatviaLebanonLesothoLiberiaLiechtensteinLithuaniaLow incomeLuxembourgMacao SAR, ChinaMacedonia, FYRMadagascarMalawiMalaysiaMaldivesMaliMaltaMarshall IslandsMauritiusMexicoMoldovaMonacoMongoliaMoroccoMozambiqueNamibiaNetherlandsNicaraguaNigerNorth AmericaNorwayOECD membersOmanPakistanPanamaParaguayPeruPhilippinesPolandPortugalPost-demographic dividendPuerto RicoQatarRomaniaRussian FederationRwandaSan MarinoSenegalSerbiaSeychellesSierra LeoneSingaporeSlovak RepublicSloveniaSouth AfricaSpainSri LankaSt. Kitts and NevisSt. LuciaSt. Vincent and the GrenadinesSwedenSwitzerlandTajikistanThailandTimor-LesteTogoTunisiaTurkeyTurkmenistanTurks and Caicos IslandsUgandaUkraineUnited KingdomUnited StatesUruguayVanuatuVenezuela, RBVietnamWest Bank and GazaYemen, Rep.Zambia

línea de tiempo (timeline):

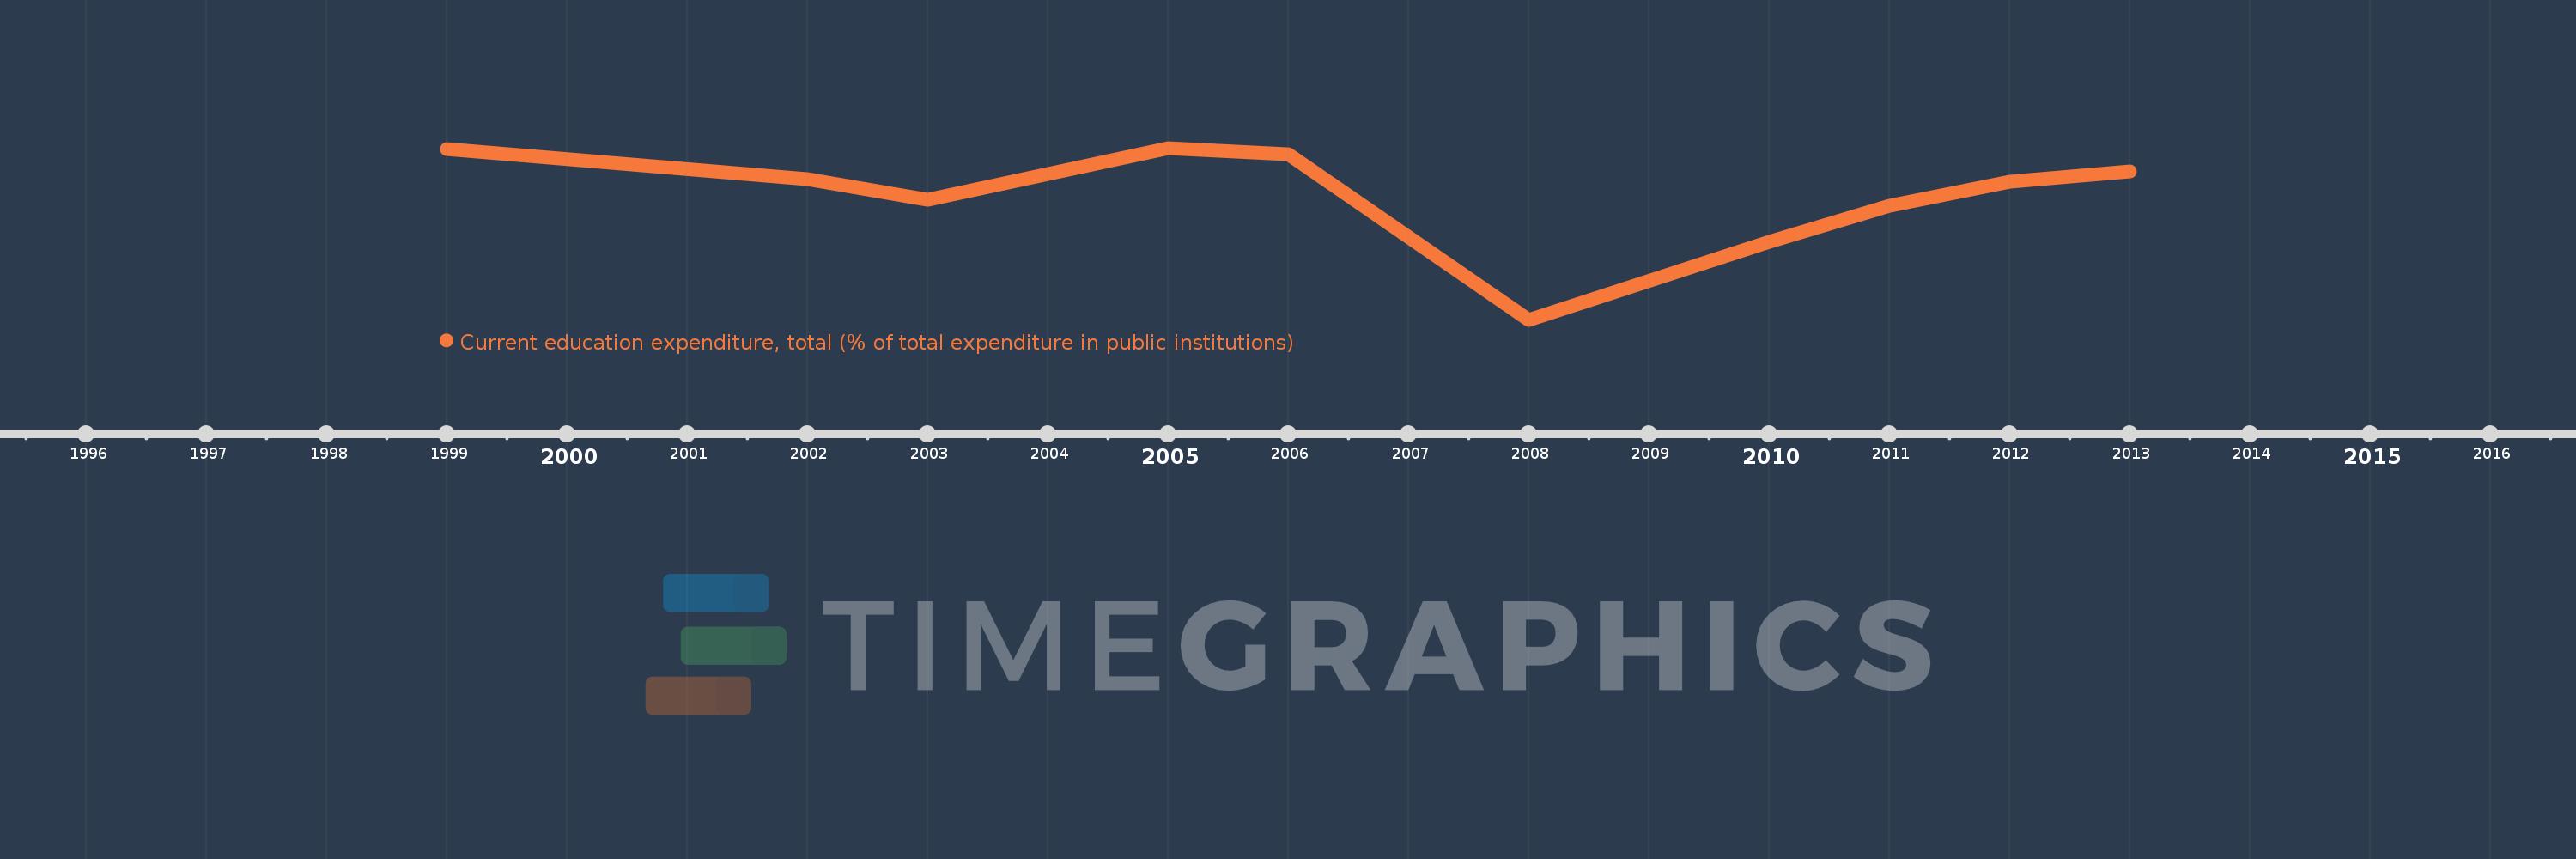
En esta escala de tiempo se presenta un gráfico de 1999 y 2013 de Romania. Los datos de 1998 están ausentes. El número de observaciones reales por fecha: 11.

Fuente (nombre):

Indicadores del desarrollo mundial

Fuente (organización):

United Nations Educational, Scientific, and Cultural Organization (UNESCO) Institute for Statistics.

Categorías:

Education

Se ha actualizado:

23 abr 2017 año

Los indicadores de los cambios de valor en los últimos años

En promedio:
90.292
Mínimo:
79.745
1 ene 2008 año
Máximo:
94.058
1 ene 2005 año
A la fecha de observación
Valor
Cambio absoluto
El cambio con respecto al valor anterior
1 ene 1999 año
93.938
+93.938
0.0%
1 ene 2002 año
91.426
-2.513
-2.67%
1 ene 2003 año
89.751
-1.675
-1.83%
1 ene 2004 año
91.922
+2.172
2.42%
1 ene 2005 año
94.058
+2.136
2.32%
1 ene 2006 año
93.535
-0.523
-0.56%
1 ene 2008 año
79.745
-13.79
-14.74%
1 ene 2010 año
86.25
+6.505
8.16%
1 ene 2011 año
89.238
+2.988
3.46%
1 ene 2012 año
91.236
+1.998
2.24%
1 ene 2013 año
92.111
+0.875
0.96%

Ranking de los países por los datos estadísticos actuales