29
/es/
es
AIzaSyAYiBZKx7MnpbEhh9jyipgxe19OcubqV5w
April 1, 2024
86346
Bhutan
BTN
true
2
1
Other taxes (% of revenue)
2010,2009,2008,2007,2006,2005,2004,2003,2002,2001,2000,1999,1998,1997,1996,1995,1994,1993,1992,1991,1990,1989,1987,1986,1985,1984,1983
Download
Estadísticas Globales de la Biblioteca →Bhutan →

Other taxes (% of revenue)

Estas estadísticas en otros países:
AfghanistanAlbaniaAlgeriaAngolaAntigua and BarbudaArab WorldArgentinaArmeniaAustraliaAustriaAzerbaijanBahamas, TheBahrainBangladeshBarbadosBelarusBelgiumBelizeBeninBhutanBoliviaBosnia and HerzegovinaBotswanaBrazilBulgariaBurkina FasoBurundiCabo VerdeCambodiaCaribbean small statesCentral African RepublicCentral Europe and the BalticsChileChinaColombiaCongo, Dem. Rep.Congo, Rep.Costa RicaCote d'IvoireCroatiaCyprusCzech RepublicDenmarkDominicaDominican RepublicEarly-demographic dividendEast Asia & PacificEast Asia & Pacific (excluding high income)East Asia & Pacific (IDA & IBRD countries)Egypt, Arab Rep.El SalvadorEquatorial GuineaEstoniaEthiopiaEuro areaEurope & Central AsiaEurope & Central Asia (excluding high income)Europe & Central Asia (IDA & IBRD countries)European UnionFijiFinlandFranceGambia, TheGeorgiaGermanyGreeceGrenadaGuatemalaHeavily indebted poor countries (HIPC)High incomeHondurasHong Kong SAR, ChinaHungaryIBRD onlyIcelandIDA & IBRD totalIDA blendIDA onlyIDA totalIndiaIndonesiaIran, Islamic Rep.IraqIrelandIsraelItalyJamaicaJapanJordanKazakhstanKenyaKiribatiKorea, Rep.KuwaitKyrgyz RepublicLao PDRLate-demographic dividendLatin America & Caribbean Latin America & Caribbean (excluding high income)Latin America & the Caribbean (IDA & IBRD countries)LatviaLeast developed countries: UN classificationLebanonLesothoLiberiaLithuaniaLow & middle incomeLow incomeLower middle incomeLuxembourgMacao SAR, ChinaMacedonia, FYRMadagascarMalawiMalaysiaMaldivesMaliMaltaMauritiusMexicoMicronesia, Fed. Sts.Middle East & North AfricaMiddle East & North Africa (excluding high income)Middle East & North Africa (IDA & IBRD countries)Middle incomeMoldovaMongoliaMoroccoMozambiqueNamibiaNepalNetherlandsNew ZealandNicaraguaNorth AmericaNorwayOECD membersOmanOther small statesPakistanPanamaPapua New GuineaParaguayPeruPhilippinesPolandPortugalPost-demographic dividendPre-demographic dividendRomaniaRussian FederationRwandaSamoaSan MarinoSao Tome and PrincipeSenegalSerbiaSeychellesSierra LeoneSingaporeSlovak RepublicSloveniaSmall statesSolomon IslandsSouth AfricaSouth AsiaSouth Asia (IDA & IBRD)SpainSri LankaSt. Kitts and NevisSt. LuciaSub-Saharan Africa Sub-Saharan Africa (excluding high income)Sub-Saharan Africa (IDA & IBRD countries)SurinameSwazilandSwedenSwitzerlandSyrian Arab RepublicTajikistanTanzaniaThailandTimor-LesteTogoTrinidad and TobagoTunisiaTurkeyUgandaUkraineUnited KingdomUnited StatesUpper middle incomeUruguayVanuatuVenezuela, RBVietnamWest Bank and GazaWorldYemen, Rep.ZambiaZimbabwe
línea de tiempo (timeline):
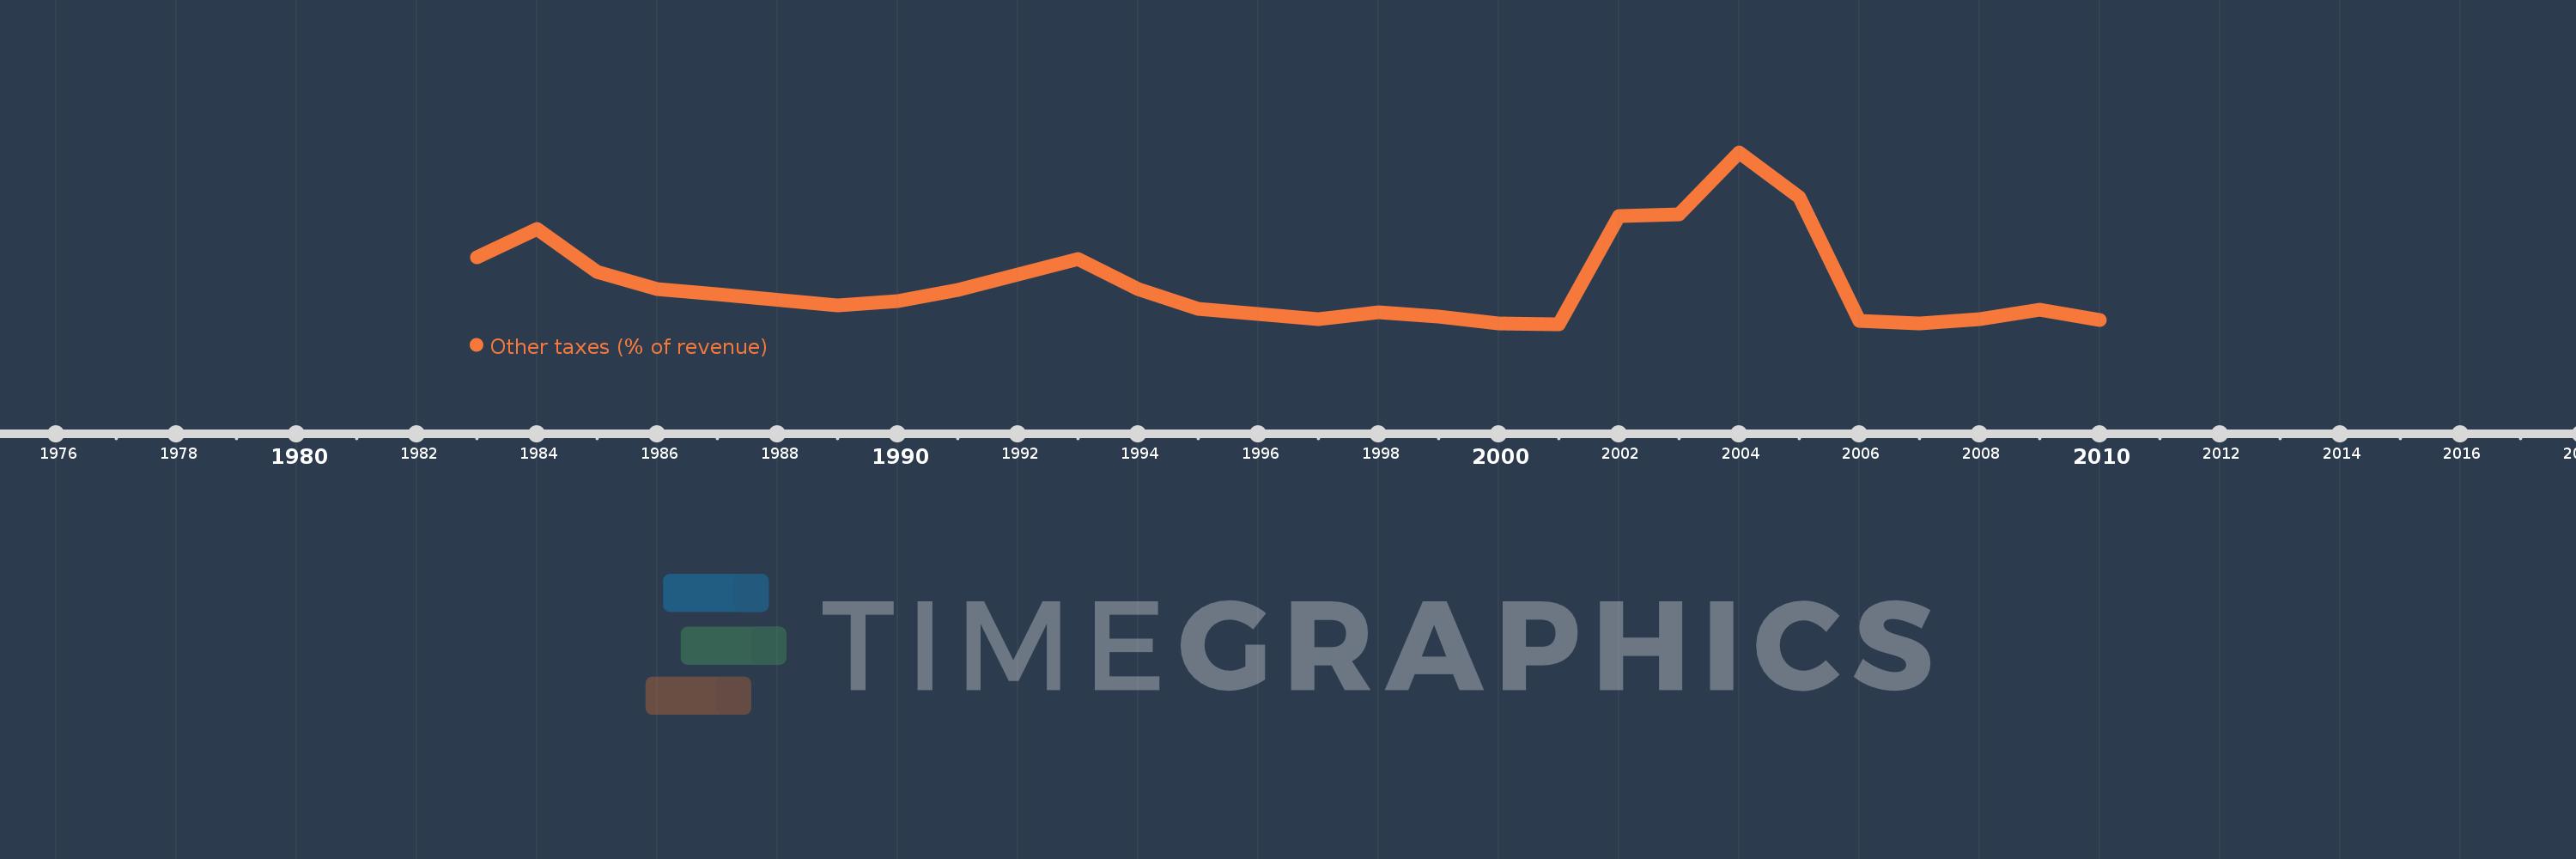
En esta escala de tiempo se presenta un gráfico de 1983 y 2010 de Bhutan. Los datos de 1982 están ausentes. El número de observaciones reales por fecha: 27.
Fuente (nombre):
Indicadores del desarrollo mundial
Fuente (organización):
International Monetary Fund, Government Finance Statistics Yearbook and data files.
Categorías:
Public Sector
Se ha actualizado:
23 abr 2017 año
Los indicadores de los cambios de valor en los últimos años
En promedio:
0.429
Mínimo:
0.095
1 ene 2001 año
Máximo:
1.503
1 ene 2004 año
A la fecha de observación
Valor
Cambio absoluto
El cambio con respecto al valor anterior
1 ene 1983 año
0.643
+0.643
0.0%
1 ene 1984 año
0.876
+0.233
36.22%
1 ene 1985 año
0.521
-0.355
-40.49%
1 ene 1986 año
0.383
-0.138
-26.55%
1 ene 1987 año
0.341
-0.042
-11.07%
1 ene 1989 año
0.25
-0.091
-26.65%
1 ene 1990 año
0.286
+0.036
14.44%
1 ene 1991 año
0.374
+0.088
30.96%
1 ene 1992 año
0.503
+0.129
34.41%
1 ene 1993 año
0.628
+0.125
24.82%
1 ene 1994 año
0.381
-0.248
-39.41%
1 ene 1995 año
0.222
-0.159
-41.67%
1 ene 1996 año
0.18
-0.042
-19.1%
1 ene 1997 año
0.136
-0.044
-24.23%
1 ene 1998 año
0.196
+0.06
44.13%
1 ene 1999 año
0.156
-0.041
-20.66%
1 ene 2000 año
0.104
-0.052
-33.21%
1 ene 2001 año
0.095
-0.009
-8.55%
1 ene 2002 año
0.98
+0.885
931.92%
1 ene 2003 año
0.998
+0.017
1.77%
1 ene 2004 año
1.503
+0.505
50.66%
1 ene 2005 año
1.139
-0.364
-24.2%
1 ene 2006 año
0.122
-1.017
-89.26%
1 ene 2007 año
0.1
-0.022
-18.27%
1 ene 2008 año
0.137
+0.037
37.07%
1 ene 2009 año
0.211
+0.074
54.25%
1 ene 2010 año
0.128
-0.083
-39.27%
Ranking de los países por los datos estadísticos actuales

Comentarios:

Enviar
PremiumAbout & FeedbackAcuerdoPrivacidad
logo
© 2022 Selected Technologies LLC – Morgan Hill, California