33
/es/
AIzaSyAYiBZKx7MnpbEhh9jyipgxe19OcubqV5w
August 1, 2025
142164
Greece
GRC
true
2
1
Other taxes (% of revenue)
2015,2014,2013,2012,2011,2010,2009,2008,2007,1991,1990,1989,1988,1987,1986,1985,1984,1983,1982,1981,1980,1979,1978,1977,1976,1975,1974,1973
Download
Estadísticas Globales de la Biblioteca →Greece →

Other taxes (% of revenue)

Estas estadísticas en otros países:

AfghanistanAlbaniaAlgeriaAngolaAntigua and BarbudaArab WorldArgentinaArmeniaAustraliaAustriaAzerbaijanBahamas, TheBahrainBangladeshBarbadosBelarusBelgiumBelizeBeninBhutanBoliviaBosnia and HerzegovinaBotswanaBrazilBulgariaBurkina FasoBurundiCabo VerdeCambodiaCaribbean small statesCentral African RepublicCentral Europe and the BalticsChileChinaColombiaCongo, Dem. Rep.Congo, Rep.Costa RicaCote d'IvoireCroatiaCyprusCzech RepublicDenmarkDominicaDominican RepublicEarly-demographic dividendEast Asia & PacificEast Asia & Pacific (excluding high income)East Asia & Pacific (IDA & IBRD countries)Egypt, Arab Rep.El SalvadorEquatorial GuineaEstoniaEthiopiaEuro areaEurope & Central AsiaEurope & Central Asia (excluding high income)Europe & Central Asia (IDA & IBRD countries)European UnionFijiFinlandFranceGambia, TheGeorgiaGermanyGreeceGrenadaGuatemalaHeavily indebted poor countries (HIPC)High incomeHondurasHong Kong SAR, ChinaHungaryIBRD onlyIcelandIDA & IBRD totalIDA blendIDA onlyIDA totalIndiaIndonesiaIran, Islamic Rep.IraqIrelandIsraelItalyJamaicaJapanJordanKazakhstanKenyaKiribatiKorea, Rep.KuwaitKyrgyz RepublicLao PDRLate-demographic dividendLatin America & Caribbean Latin America & Caribbean (excluding high income)Latin America & the Caribbean (IDA & IBRD countries)LatviaLeast developed countries: UN classificationLebanonLesothoLiberiaLithuaniaLow & middle incomeLow incomeLower middle incomeLuxembourgMacao SAR, ChinaMacedonia, FYRMadagascarMalawiMalaysiaMaldivesMaliMaltaMauritiusMexicoMicronesia, Fed. Sts.Middle East & North AfricaMiddle East & North Africa (excluding high income)Middle East & North Africa (IDA & IBRD countries)Middle incomeMoldovaMongoliaMoroccoMozambiqueNamibiaNepalNetherlandsNew ZealandNicaraguaNorth AmericaNorwayOECD membersOmanOther small statesPakistanPanamaPapua New GuineaParaguayPeruPhilippinesPolandPortugalPost-demographic dividendPre-demographic dividendRomaniaRussian FederationRwandaSamoaSan MarinoSao Tome and PrincipeSenegalSerbiaSeychellesSierra LeoneSingaporeSlovak RepublicSloveniaSmall statesSolomon IslandsSouth AfricaSouth AsiaSouth Asia (IDA & IBRD)SpainSri LankaSt. Kitts and NevisSt. LuciaSub-Saharan Africa Sub-Saharan Africa (excluding high income)Sub-Saharan Africa (IDA & IBRD countries)SurinameSwazilandSwedenSwitzerlandSyrian Arab RepublicTajikistanTanzaniaThailandTimor-LesteTogoTrinidad and TobagoTunisiaTurkeyUgandaUkraineUnited KingdomUnited StatesUpper middle incomeUruguayVanuatuVenezuela, RBVietnamWest Bank and GazaWorldYemen, Rep.ZambiaZimbabwe

línea de tiempo (timeline):

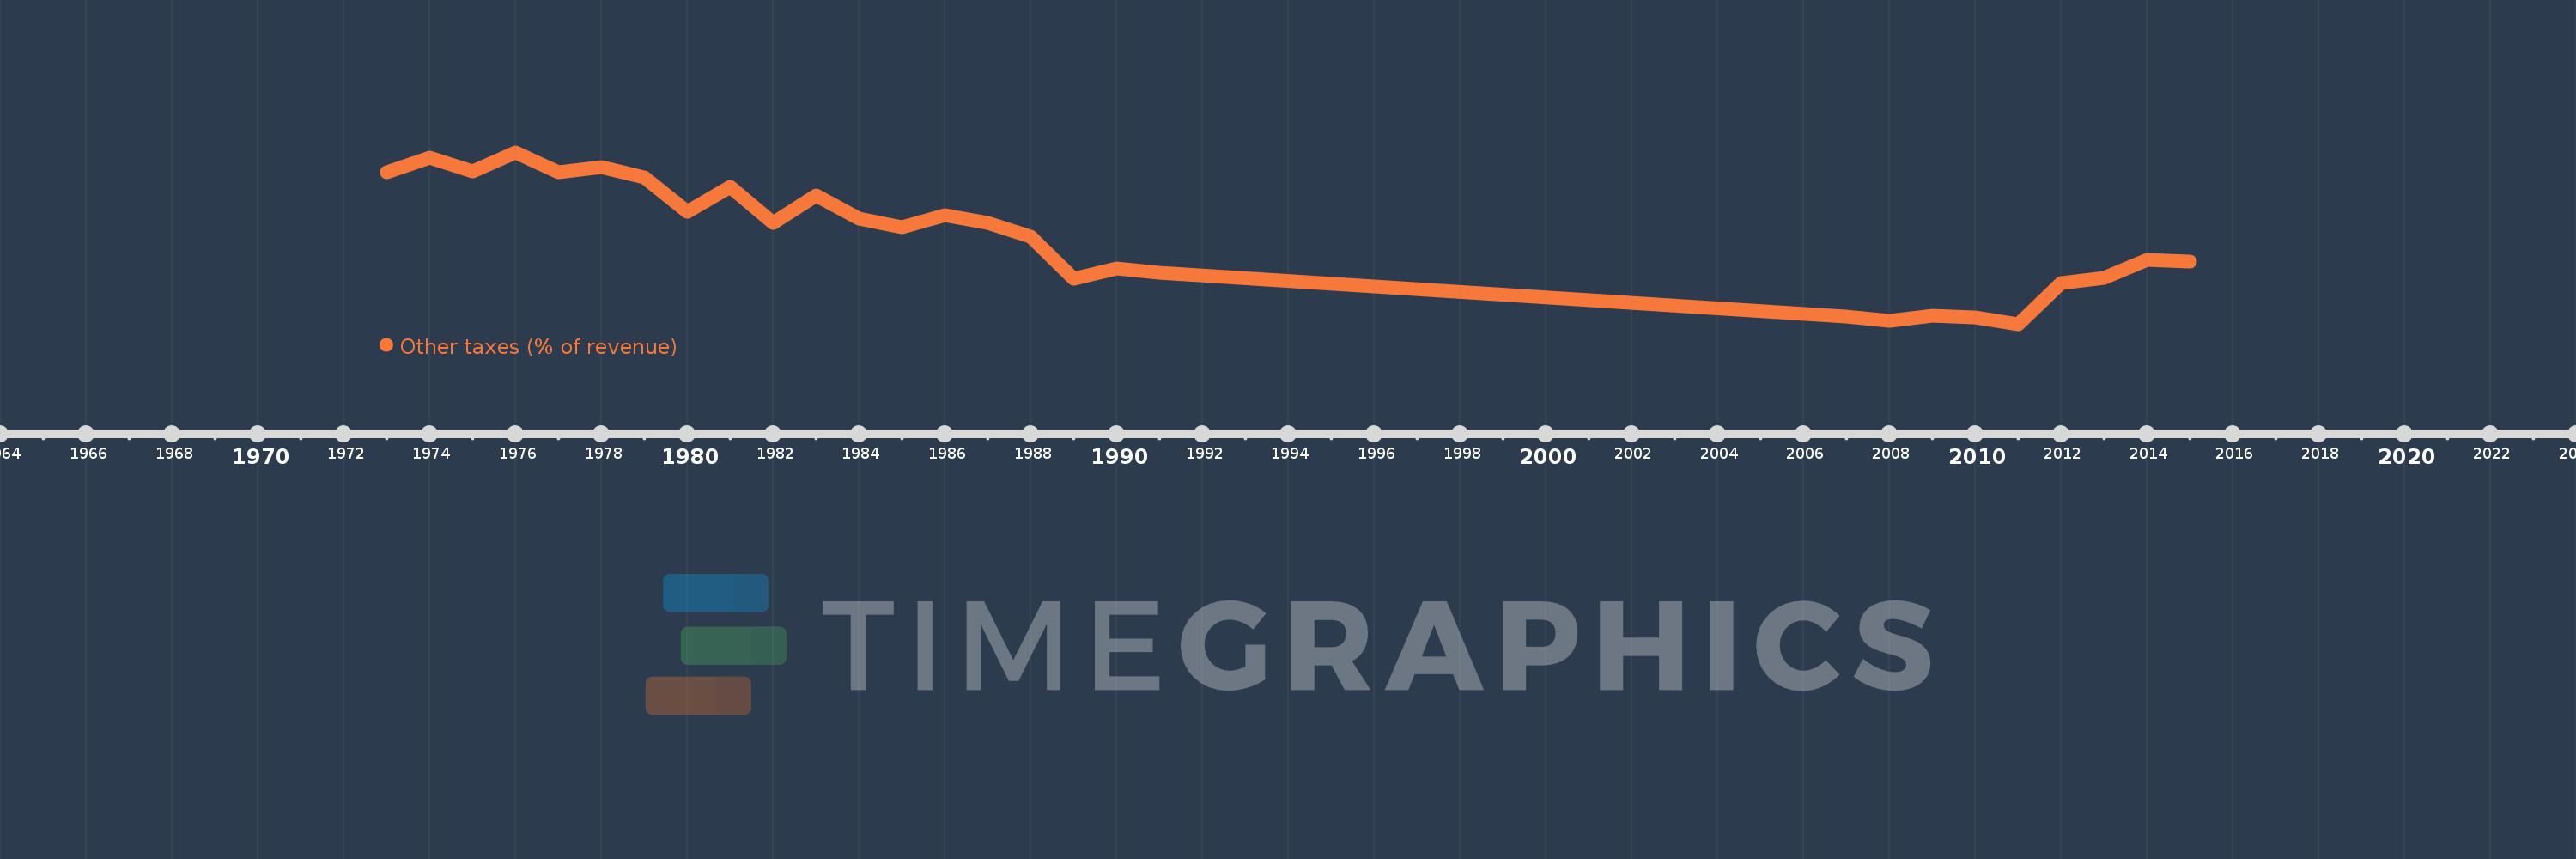
En esta escala de tiempo se presenta un gráfico de 1973 y 2015 de Greece. Los datos de 1972 están ausentes. El número de observaciones reales por fecha: 28.

Fuente (nombre):

Indicadores del desarrollo mundial

Fuente (organización):

International Monetary Fund, Government Finance Statistics Yearbook and data files.

Categorías:

Public Sector

Se ha actualizado:

23 abr 2017 año

Los indicadores de los cambios de valor en los últimos años

En promedio:
5.662
Mínimo:
1.66
1 ene 2011 año
Máximo:
9.447
1 ene 1976 año
A la fecha de observación
Valor
Cambio absoluto
El cambio con respecto al valor anterior
1 ene 1973 año
8.549
+8.549
0.0%
1 ene 1974 año
9.214
+0.665
7.78%
1 ene 1975 año
8.6
-0.614
-6.67%
1 ene 1976 año
9.447
+0.847
9.85%
1 ene 1977 año
8.55
-0.897
-9.5%
1 ene 1978 año
8.79
+0.24
2.81%
1 ene 1979 año
8.328
-0.462
-5.26%
1 ene 1980 año
6.763
-1.565
-18.79%
1 ene 1981 año
7.892
+1.129
16.7%
1 ene 1982 año
6.237
-1.656
-20.98%
1 ene 1983 año
7.478
+1.242
19.91%
1 ene 1984 año
6.427
-1.051
-14.05%
1 ene 1985 año
6.058
-0.37
-5.75%
1 ene 1986 año
6.591
+0.533
8.81%
1 ene 1987 año
6.254
-0.337
-5.12%
1 ene 1988 año
5.623
-0.631
-10.09%
1 ene 1989 año
3.712
-1.91
-33.97%
1 ene 1990 año
4.176
+0.464
12.49%
1 ene 1991 año
4.008
-0.168
-4.03%
1 ene 2007 año
2.0
-2.007
-50.09%
1 ene 2008 año
1.808
-0.193
-9.64%
1 ene 2009 año
2.043
+0.235
13.02%
1 ene 2010 año
1.979
-0.063
-3.1%
1 ene 2011 año
1.66
-0.32
-16.15%
1 ene 2012 año
3.518
+1.858
111.95%
1 ene 2013 año
3.775
+0.257
7.32%
1 ene 2014 año
4.557
+0.782
20.72%
1 ene 2015 año
4.508
-0.05
-1.09%

Ranking de los países por los datos estadísticos actuales