33
/es/
AIzaSyB4mHJ5NPEv-XzF7P6NDYXjlkCWaeKw5bc
November 30, 2025
85265
Bermuda
BMU
true
2
1
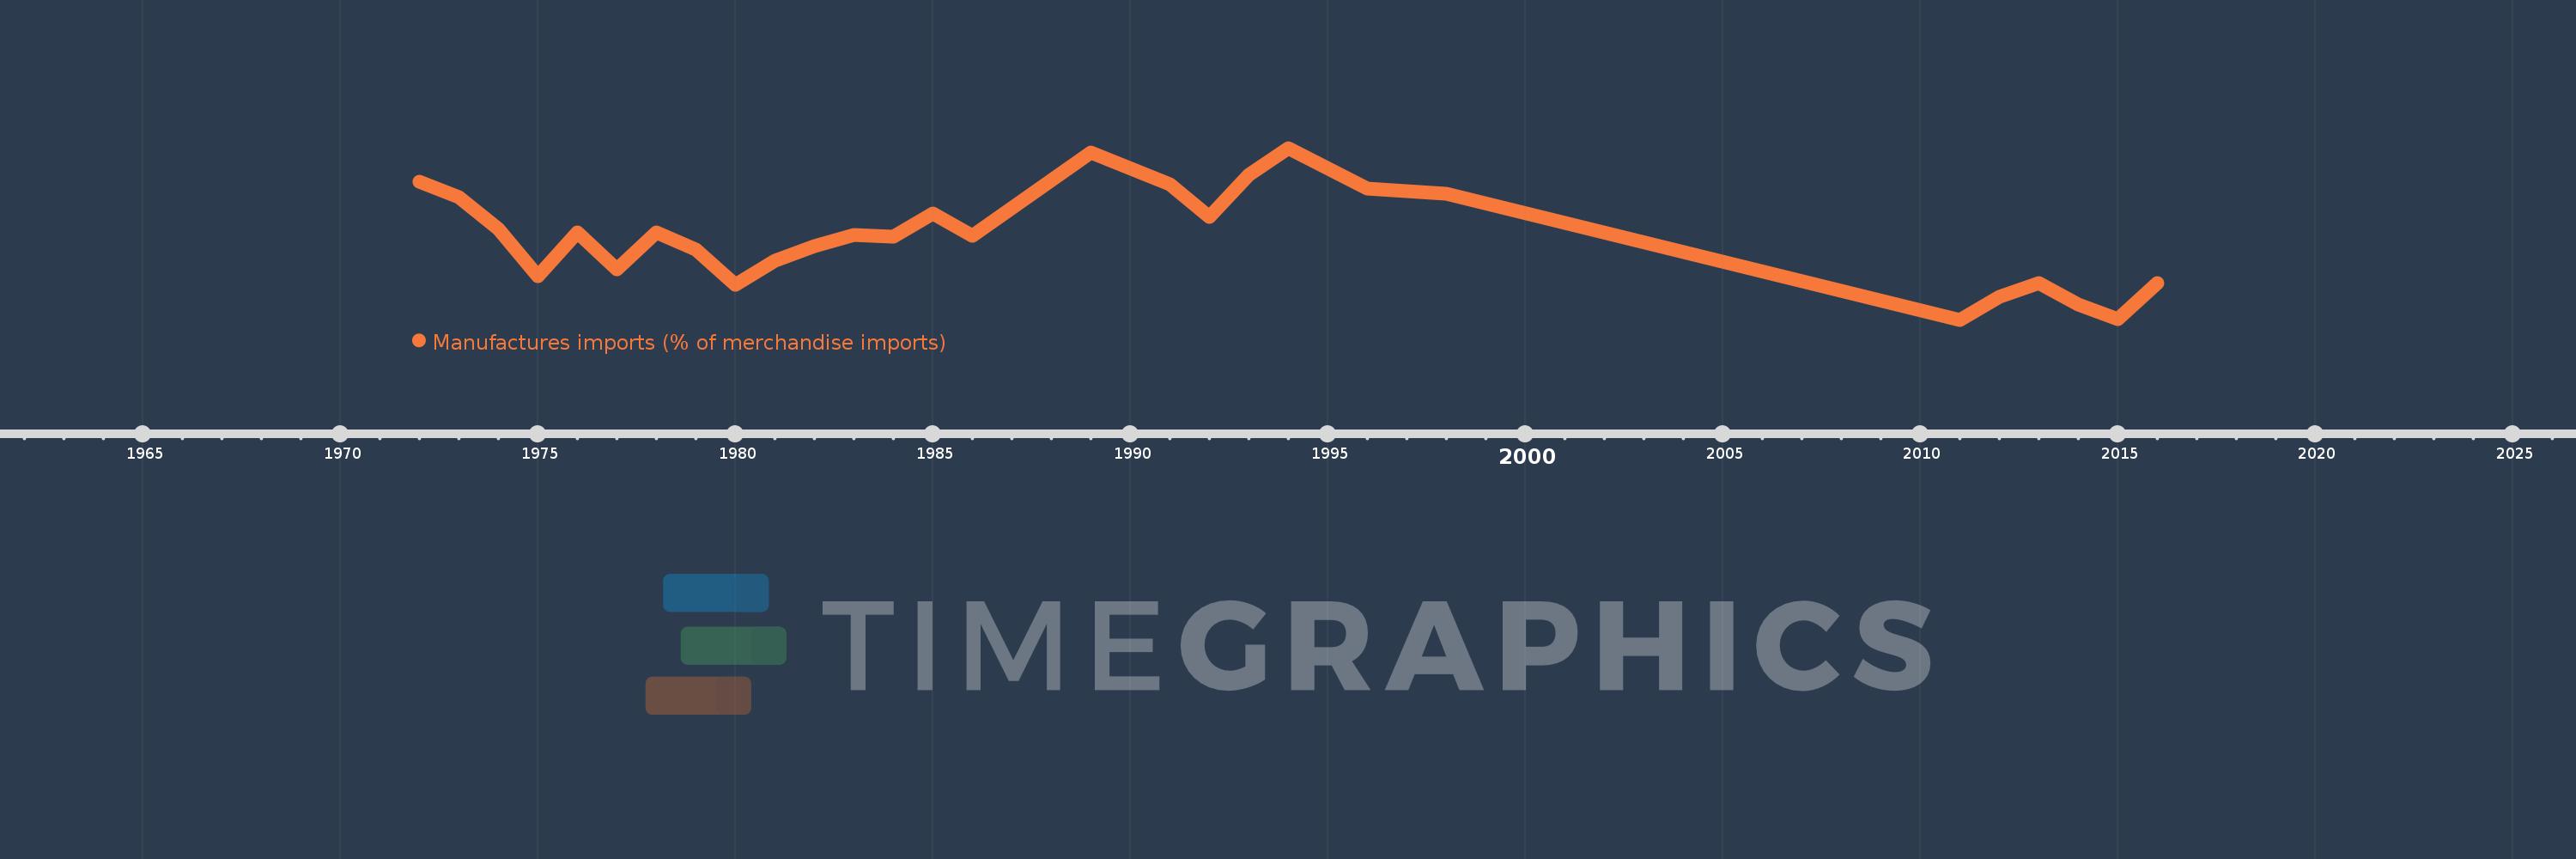
Manufactures imports (% of merchandise imports)
2016,2015,2014,2013,2012,2011,1998,1996,1994,1993,1992,1991,1989,1986,1985,1984,1983,1982,1981,1980,1979,1978,1977,1976,1975,1974,1973,1972