33
/es/
AIzaSyAYiBZKx7MnpbEhh9jyipgxe19OcubqV5w
August 1, 2025
233814
Sao Tome and Principe
STP
true
2
1
Manufactures imports (% of merchandise imports)
2016,2015,2014,2013,2012,2011,2010,2009,2008,2007,2006,2005,2004,2003,2002,2001,2000
Download
Estadísticas Globales de la Biblioteca →Sao Tome and Principe →

Manufactures imports (% of merchandise imports)

Estas estadísticas en otros países:

AfghanistanAlbaniaAlgeriaAndorraAngolaAntigua and BarbudaArab WorldArgentinaArmeniaArubaAustraliaAustriaAzerbaijanBahamas, TheBahrainBangladeshBarbadosBelarusBelgiumBelizeBeninBermudaBhutanBoliviaBosnia and HerzegovinaBotswanaBrazilBrunei DarussalamBulgariaBurkina FasoBurundiCabo VerdeCambodiaCameroonCanadaCaribbean small statesCayman IslandsCentral African RepublicCentral Europe and the BalticsChadChileChinaColombiaComorosCongo, Dem. Rep.Congo, Rep.Costa RicaCote d'IvoireCroatiaCubaCyprusCzech RepublicDenmarkDjiboutiDominicaDominican RepublicEarly-demographic dividendEast Asia & PacificEast Asia & Pacific (excluding high income)East Asia & Pacific (IDA & IBRD countries)EcuadorEgypt, Arab Rep.El SalvadorEquatorial GuineaEritreaEstoniaEthiopiaEuro areaEurope & Central AsiaEurope & Central Asia (excluding high income)Europe & Central Asia (IDA & IBRD countries)European UnionFaroe IslandsFijiFinlandFragile and conflict affected situationsFranceFrench PolynesiaGabonGambia, TheGeorgiaGermanyGhanaGreeceGreenlandGrenadaGuatemalaGuineaGuinea-BissauGuyanaHaitiHeavily indebted poor countries (HIPC)High incomeHondurasHong Kong SAR, ChinaHungaryIBRD onlyIcelandIDA & IBRD totalIDA blendIDA onlyIDA totalIndiaIndonesiaIran, Islamic Rep.IraqIrelandIsraelItalyJamaicaJapanJordanKazakhstanKenyaKiribatiKorea, Rep.KuwaitKyrgyz RepublicLao PDRLate-demographic dividendLatin America & Caribbean Latin America & Caribbean (excluding high income)Latin America & the Caribbean (IDA & IBRD countries)LatviaLeast developed countries: UN classificationLebanonLesothoLiberiaLibyaLithuaniaLow & middle incomeLow incomeLower middle incomeLuxembourgMacao SAR, ChinaMacedonia, FYRMadagascarMalawiMalaysiaMaldivesMaliMaltaMauritaniaMauritiusMexicoMiddle East & North AfricaMiddle East & North Africa (excluding high income)Middle East & North Africa (IDA & IBRD countries)Middle incomeMoldovaMongoliaMoroccoMozambiqueMyanmarNamibiaNepalNetherlandsNew CaledoniaNew ZealandNicaraguaNigerNigeriaNorth AmericaNorwayOECD membersOmanOther small statesPacific island small statesPakistanPalauPanamaPapua New GuineaParaguayPeruPhilippinesPolandPortugalPost-demographic dividendPre-demographic dividendQatarRomaniaRussian FederationRwandaSamoaSao Tome and PrincipeSaudi ArabiaSenegalSerbiaSeychellesSierra LeoneSingaporeSlovak RepublicSloveniaSmall statesSolomon IslandsSomaliaSouth AfricaSouth AsiaSouth Asia (IDA & IBRD)SpainSri LankaSt. Kitts and NevisSt. LuciaSt. Vincent and the GrenadinesSub-Saharan Africa Sub-Saharan Africa (excluding high income)Sub-Saharan Africa (IDA & IBRD countries)SudanSurinameSwazilandSwedenSwitzerlandSyrian Arab RepublicTajikistanTanzaniaThailandTimor-LesteTogoTongaTrinidad and TobagoTunisiaTurkeyTurkmenistanTurks and Caicos IslandsTuvaluUgandaUkraineUnited Arab EmiratesUnited KingdomUnited StatesUpper middle incomeUruguayVanuatuVenezuela, RBVietnamVirgin Islands (U.S.)WorldYemen, Rep.ZambiaZimbabwe

línea de tiempo (timeline):

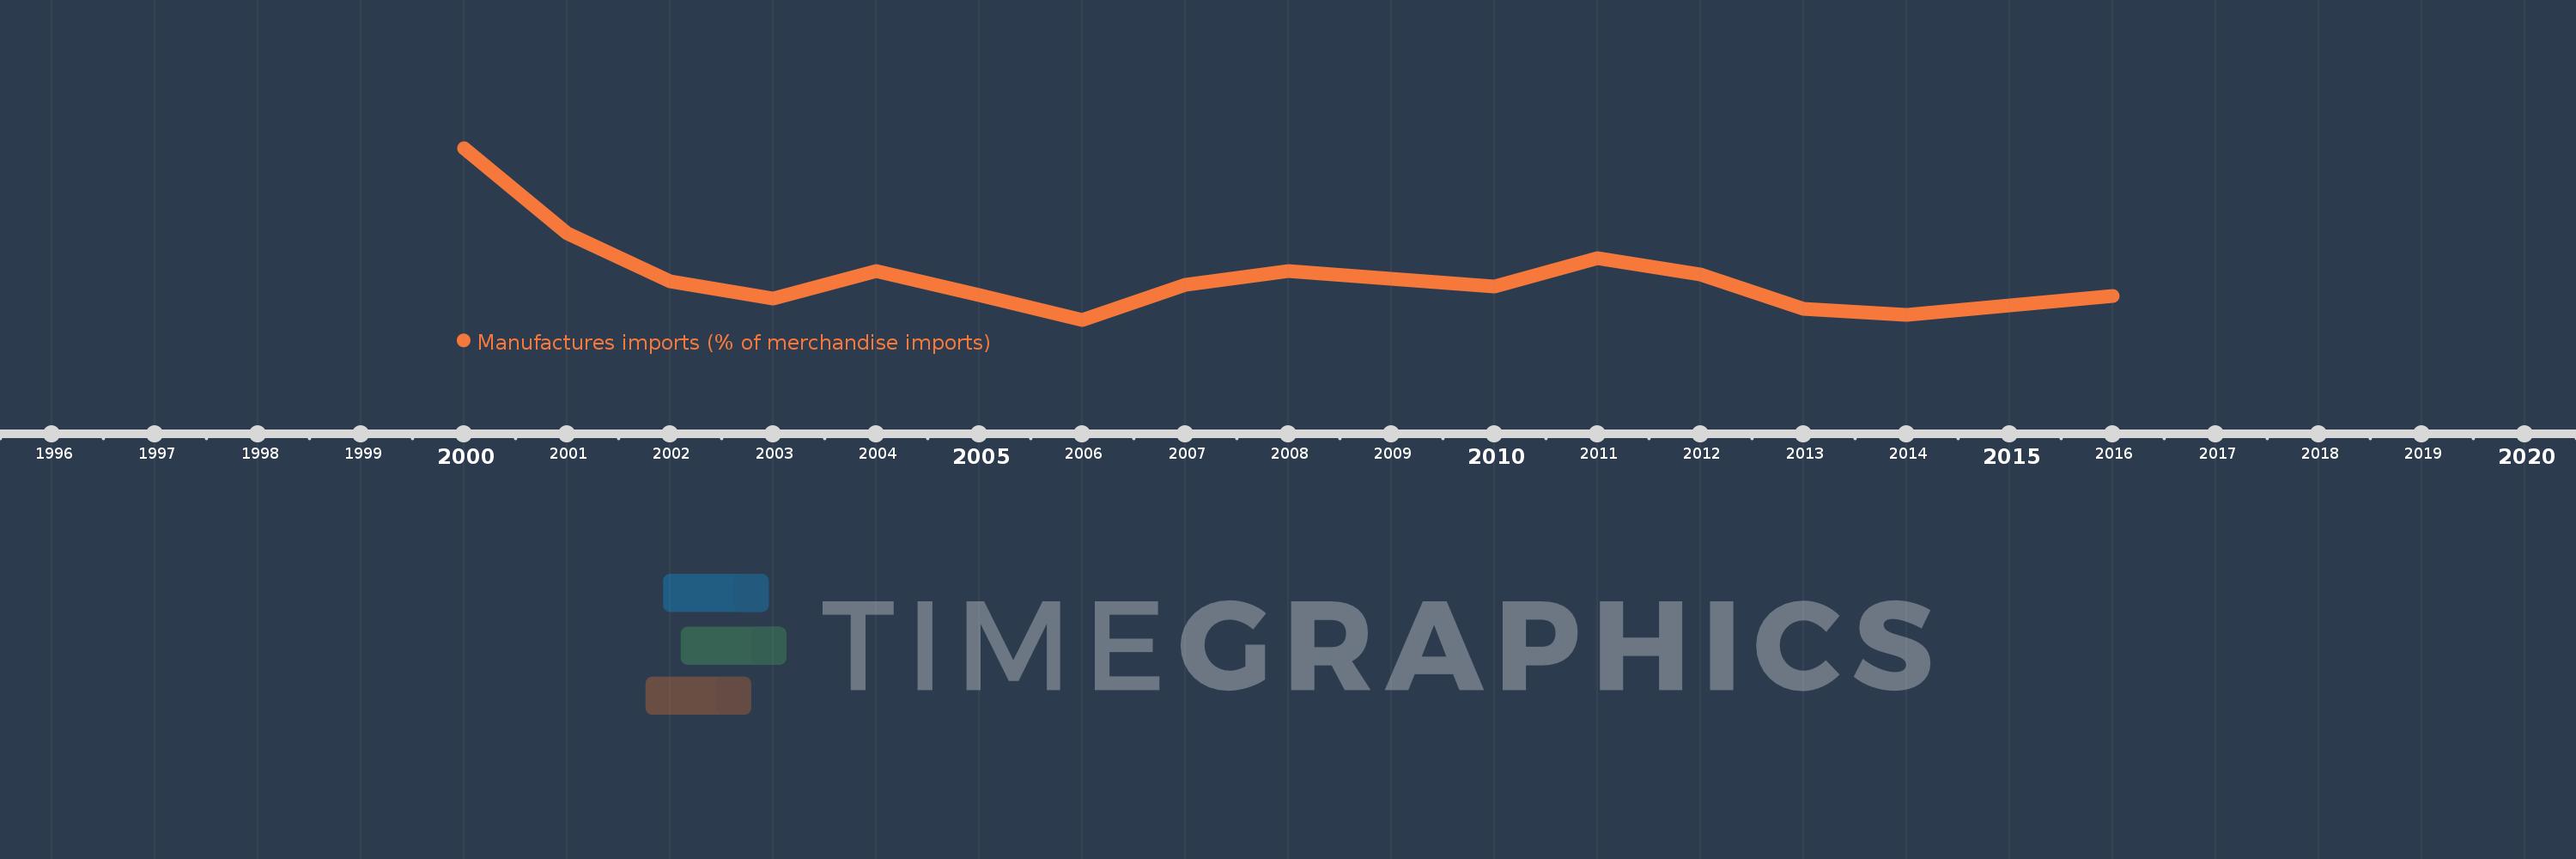
En esta escala de tiempo se presenta un gráfico de 2000 y 2016 de Sao Tome and Principe. Los datos de 1999 están ausentes. El número de observaciones reales por fecha: 17.

Fuente (nombre):

Indicadores del desarrollo mundial

Fuente (organización):

World Bank staff estimates from the Comtrade database maintained by the United Nations Statistics Division.

Categorías:

Private Sector, Trade

Se ha actualizado:

23 abr 2017 año

Los indicadores de los cambios de valor en los últimos años

En promedio:
48.158
Mínimo:
40.114
1 ene 2006 año
Máximo:
73.214
1 ene 2000 año
A la fecha de observación
Valor
Cambio absoluto
El cambio con respecto al valor anterior
1 ene 2000 año
73.214
+73.214
0.0%
1 ene 2001 año
56.736
-16.478
-22.51%
1 ene 2002 año
47.435
-9.301
-16.39%
1 ene 2003 año
44.263
-3.172
-6.69%
1 ene 2004 año
49.466
+5.203
11.76%
1 ene 2005 año
44.903
-4.563
-9.23%
1 ene 2006 año
40.114
-4.788
-10.66%
1 ene 2007 año
46.93
+6.815
16.99%
1 ene 2008 año
49.572
+2.642
5.63%
1 ene 2009 año
47.984
-1.588
-3.2%
1 ene 2010 año
46.566
-1.418
-2.96%
1 ene 2011 año
51.966
+5.4
11.6%
1 ene 2012 año
48.853
-3.112
-5.99%
1 ene 2013 año
42.191
-6.662
-13.64%
1 ene 2014 año
41.017
-1.174
-2.78%
1 ene 2015 año
42.842
+1.825
4.45%
1 ene 2016 año
44.639
+1.797
4.19%

Ranking de los países por los datos estadísticos actuales