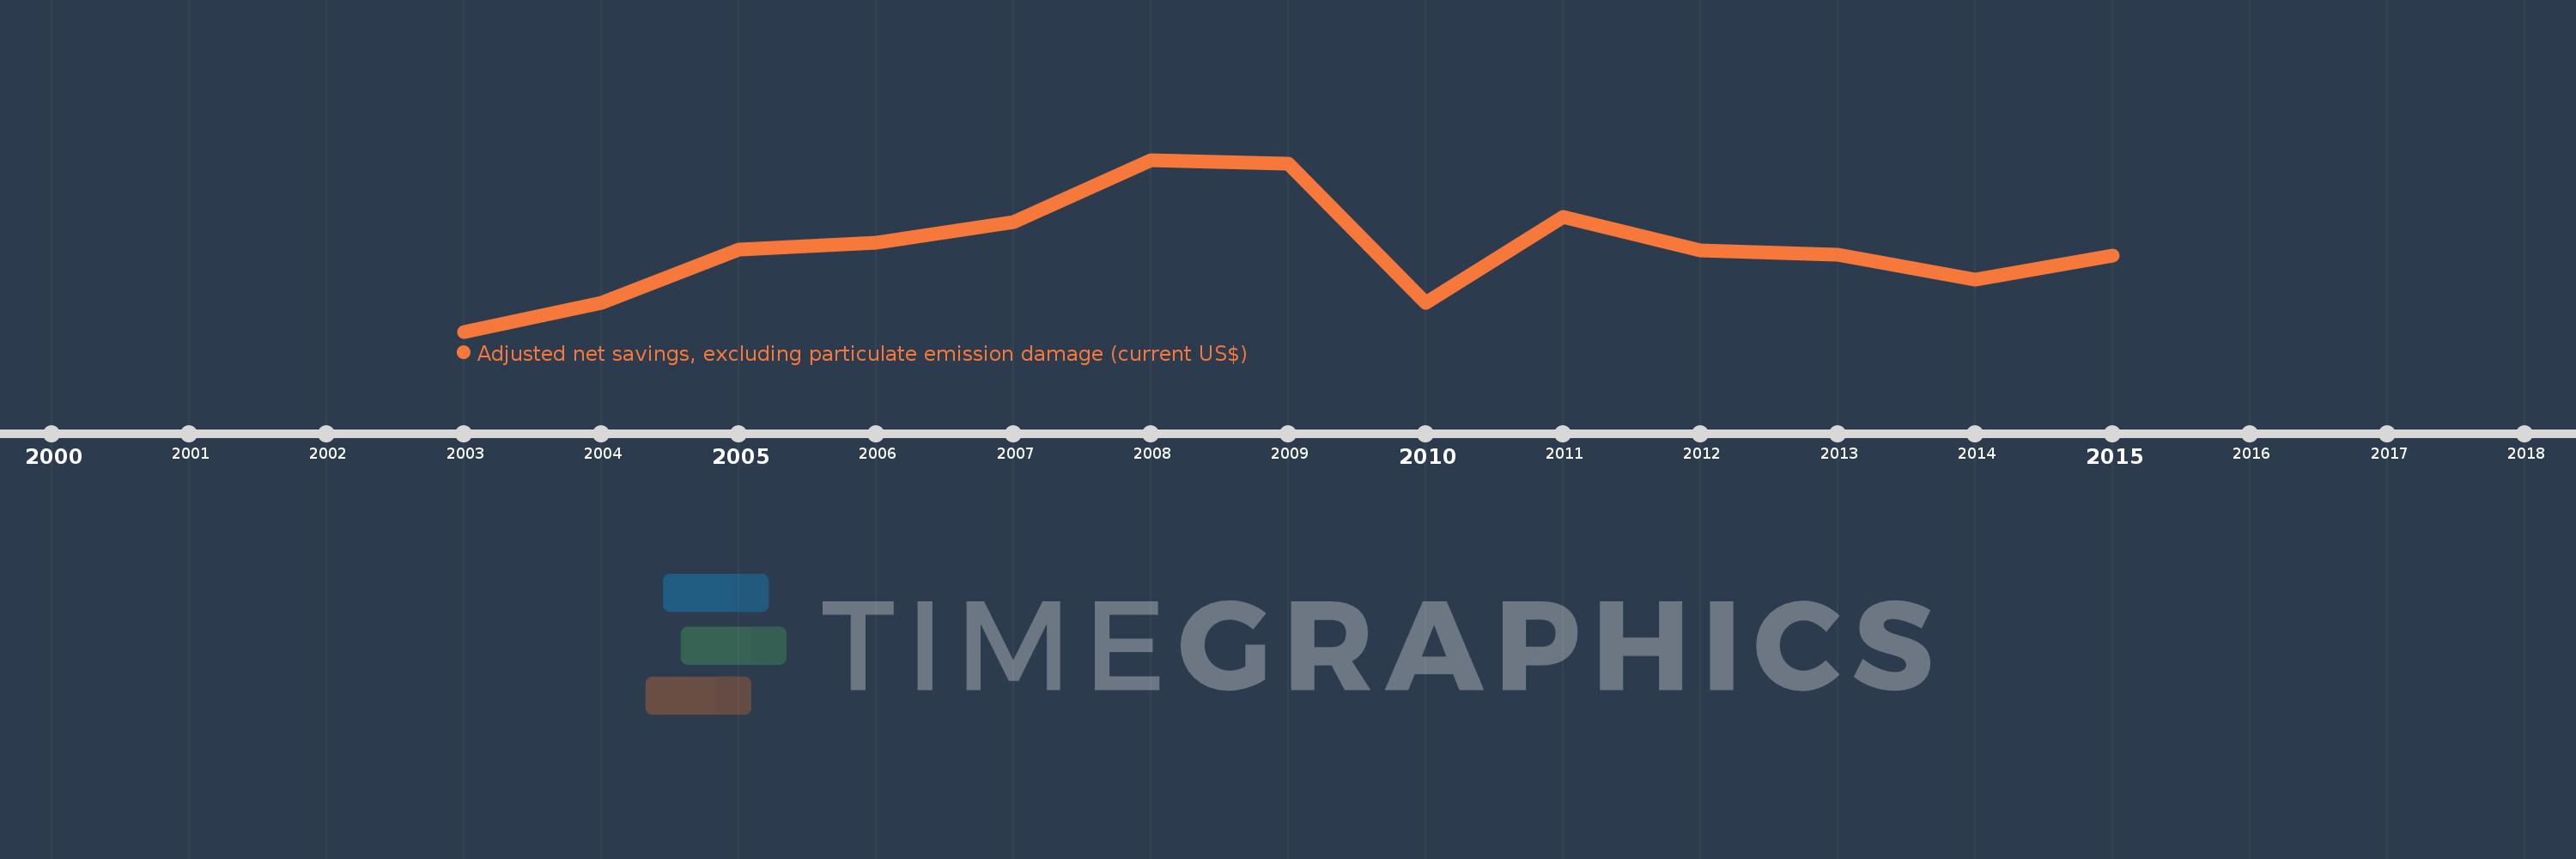
En esta escala de tiempo se presenta un gráfico de 2003 y 2015 de Belgium. Los datos de 2002 están ausentes. El número de observaciones reales por fecha: 13.
Fuente (nombre):
Indicadores del desarrollo mundial
Fuente (organización):
World Bank staff estimates based on sources and methods in World Bank's "The Changing Wealth of Nations: Measuring Sustainable Development in the New Millennium" (2011).
Categorías:
Economy & Growth, Environment
Se ha actualizado:
23 abr 2017 año
Los indicadores de los cambios de valor en los últimos años
En promedio:
55.428 bn
Mínimo:
37.822 bn
1 ene 2003 año
Máximo:
74.297 bn
1 ene 2008 año
A la fecha de observación
Valor
Cambio absoluto
El cambio con respecto al valor anterior
1 ene 2003 año
37.822 bn
+37.822 bn
0.0%
1 ene 2004 año
43.921 bn
+6.099 bn
16.13%
1 ene 2005 año
55.243 bn
+11.322 bn
25.78%
1 ene 2006 año
56.746 bn
+1.503 bn
2.72%
1 ene 2007 año
61.008 bn
+4.263 bn
7.51%
1 ene 2008 año
74.297 bn
+13.289 bn
21.78%
1 ene 2009 año
73.4 bn
-896.5 millones
-1.21%
1 ene 2010 año
44.018 bn
-29.383 bn
-40.03%
1 ene 2011 año
62.222 bn
+18.205 bn
41.36%
1 ene 2012 año
54.977 bn
-7.245 bn
-11.64%
1 ene 2013 año
54.227 bn
-750.058 millones
-1.36%
1 ene 2014 año
48.79 bn
-5.437 bn
-10.03%
1 ene 2015 año
53.899 bn
+5.109 bn
10.47%
Ranking de los países por los datos estadísticos actuales