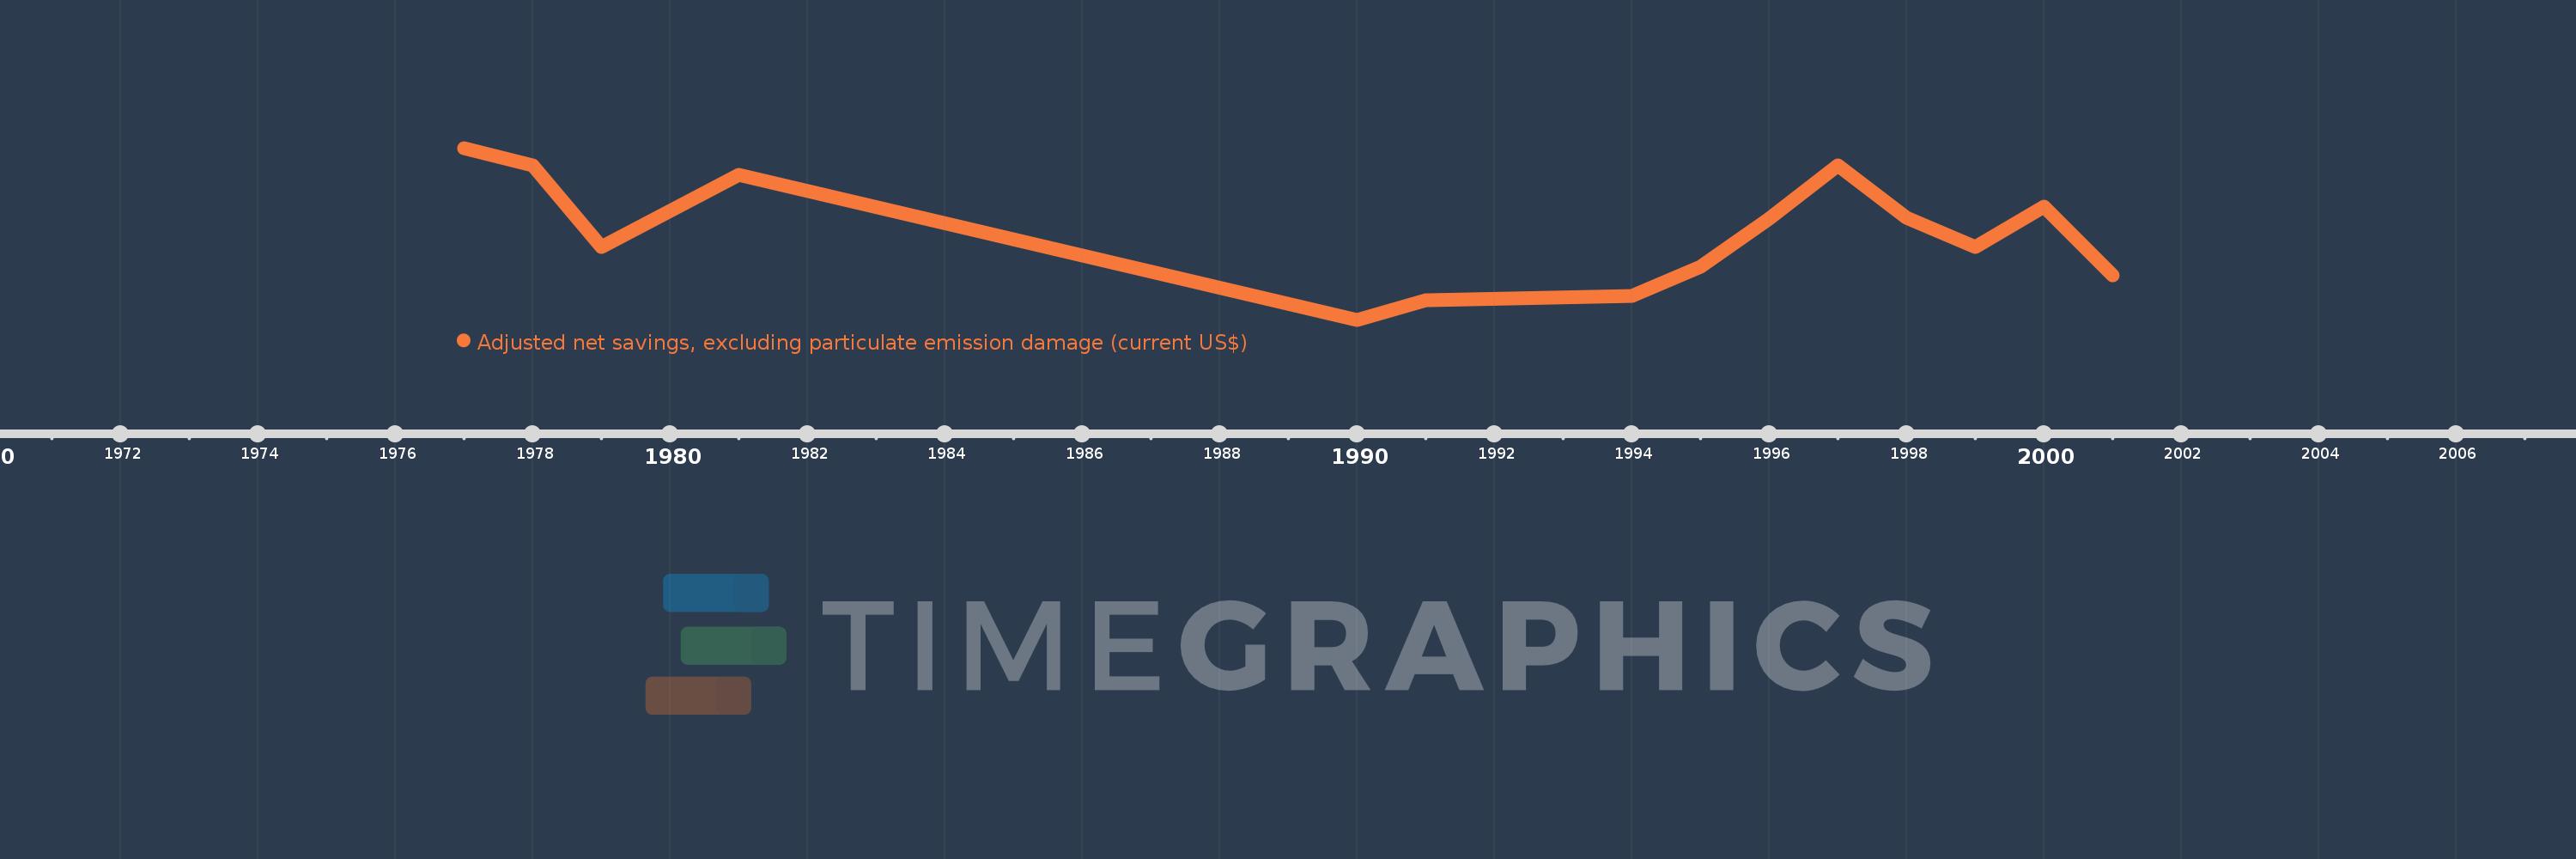
En esta escala de tiempo se presenta un gráfico de 1977 y 2001 de Iran, Islamic Rep.. Los datos de 1976 están ausentes. El número de observaciones reales por fecha: 15.
Fuente (nombre):
Indicadores del desarrollo mundial
Fuente (organización):
World Bank staff estimates based on sources and methods in World Bank's "The Changing Wealth of Nations: Measuring Sustainable Development in the New Millennium" (2011).
Categorías:
Economy & Growth, Environment
Se ha actualizado:
23 abr 2017 año
Los indicadores de los cambios de valor en los últimos años
En promedio:
14.208 bn
Mínimo:
3.867 bn
1 ene 1990 año
Máximo:
23.808 bn
1 ene 1977 año
A la fecha de observación
Valor
Cambio absoluto
El cambio con respecto al valor anterior
1 ene 1977 año
23.808 bn
+23.808 bn
0.0%
1 ene 1978 año
21.771 bn
-2.037 bn
-8.55%
1 ene 1979 año
12.324 bn
-9.448 bn
-43.39%
1 ene 1980 año
16.545 bn
+4.221 bn
34.25%
1 ene 1981 año
20.73 bn
+4.185 bn
25.29%
1 ene 1990 año
3.867 bn
-16.863 bn
-81.35%
1 ene 1991 año
6.166 bn
+2.3 bn
59.47%
1 ene 1994 año
6.583 bn
+416.858 millones
6.76%
1 ene 1995 año
10.022 bn
+3.439 bn
52.24%
1 ene 1996 año
15.577 bn
+5.556 bn
55.43%
1 ene 1997 año
21.745 bn
+6.167 bn
39.59%
1 ene 1998 año
15.699 bn
-6.046 bn
-27.8%
1 ene 1999 año
12.323 bn
-3.376 bn
-21.51%
1 ene 2000 año
16.952 bn
+4.628 bn
37.56%
1 ene 2001 año
9.009 bn
-7.942 bn
-46.85%
Ranking de los países por los datos estadísticos actuales