33
/es/
AIzaSyAYiBZKx7MnpbEhh9jyipgxe19OcubqV5w
May 1, 2025
72770
Australia
AUS
true
2
1
Claims on other sectors of the domestic economy (% of GDP)
2016,2015,2014,2013,2012,2011,2010,2009,2008,2007,2006,2005,2004,2003,2002
Download
Estadísticas Globales de la Biblioteca →Australia →

Claims on other sectors of the domestic economy (% of GDP)

Estas estadísticas en otros países:

AfghanistanAlbaniaAlgeriaAngolaAntigua and BarbudaArmeniaAustraliaAustriaAzerbaijanBangladeshBarbadosBelarusBelgiumBelizeBeninBhutanBoliviaBosnia and HerzegovinaBotswanaBrazilBrunei DarussalamBulgariaBurkina FasoBurundiCabo VerdeCambodiaCameroonCanadaCaribbean small statesCentral African RepublicCentral Europe and the BalticsChadChileColombiaComorosCongo, Dem. Rep.Congo, Rep.Costa RicaCote d'IvoireCroatiaCyprusCzech RepublicDenmarkDominicaDominican RepublicEast Asia & PacificEcuadorEgypt, Arab Rep.El SalvadorEquatorial GuineaEritreaEstoniaEuro areaEurope & Central AsiaEurope & Central Asia (excluding high income)Europe & Central Asia (IDA & IBRD countries)European UnionFijiFinlandFragile and conflict affected situationsFranceGabonGambia, TheGeorgiaGermanyGhanaGreeceGrenadaGuatemalaGuinea-BissauGuyanaHaitiHeavily indebted poor countries (HIPC)High incomeHondurasHungaryIcelandIDA blendIDA onlyIDA totalIndonesiaIraqIrelandIsraelItalyJamaicaJapanKazakhstanKenyaKorea, Rep.KosovoKuwaitKyrgyz RepublicLatin America & Caribbean Latin America & Caribbean (excluding high income)Latin America & the Caribbean (IDA & IBRD countries)LatviaLeast developed countries: UN classificationLesothoLithuaniaLow incomeLuxembourgMacao SAR, ChinaMacedonia, FYRMalaysiaMaldivesMaliMaltaMauritiusMexicoMiddle East & North AfricaMiddle East & North Africa (excluding high income)Middle East & North Africa (IDA & IBRD countries)MoldovaMongoliaMoroccoMozambiqueMyanmarNamibiaNepalNetherlandsNicaraguaNigerNigeriaNorth AmericaNorwayOECD membersOmanOther small statesPacific island small statesPakistanPanamaPapua New GuineaParaguayPhilippinesPolandPortugalPost-demographic dividendPre-demographic dividendQatarRomaniaRussian FederationRwandaSamoaSao Tome and PrincipeSenegalSerbiaSeychellesSierra LeoneSlovak RepublicSloveniaSmall statesSolomon IslandsSouth AfricaSouth SudanSpainSri LankaSt. Kitts and NevisSt. LuciaSt. Vincent and the GrenadinesSub-Saharan Africa Sub-Saharan Africa (excluding high income)Sub-Saharan Africa (IDA & IBRD countries)SudanSurinameSwazilandSwedenSyrian Arab RepublicTajikistanTanzaniaThailandTimor-LesteTogoTongaTrinidad and TobagoTurkeyUgandaUkraineUnited Arab EmiratesUnited StatesUruguayVanuatuVenezuela, RBWest Bank and GazaWorldZambia

línea de tiempo (timeline):

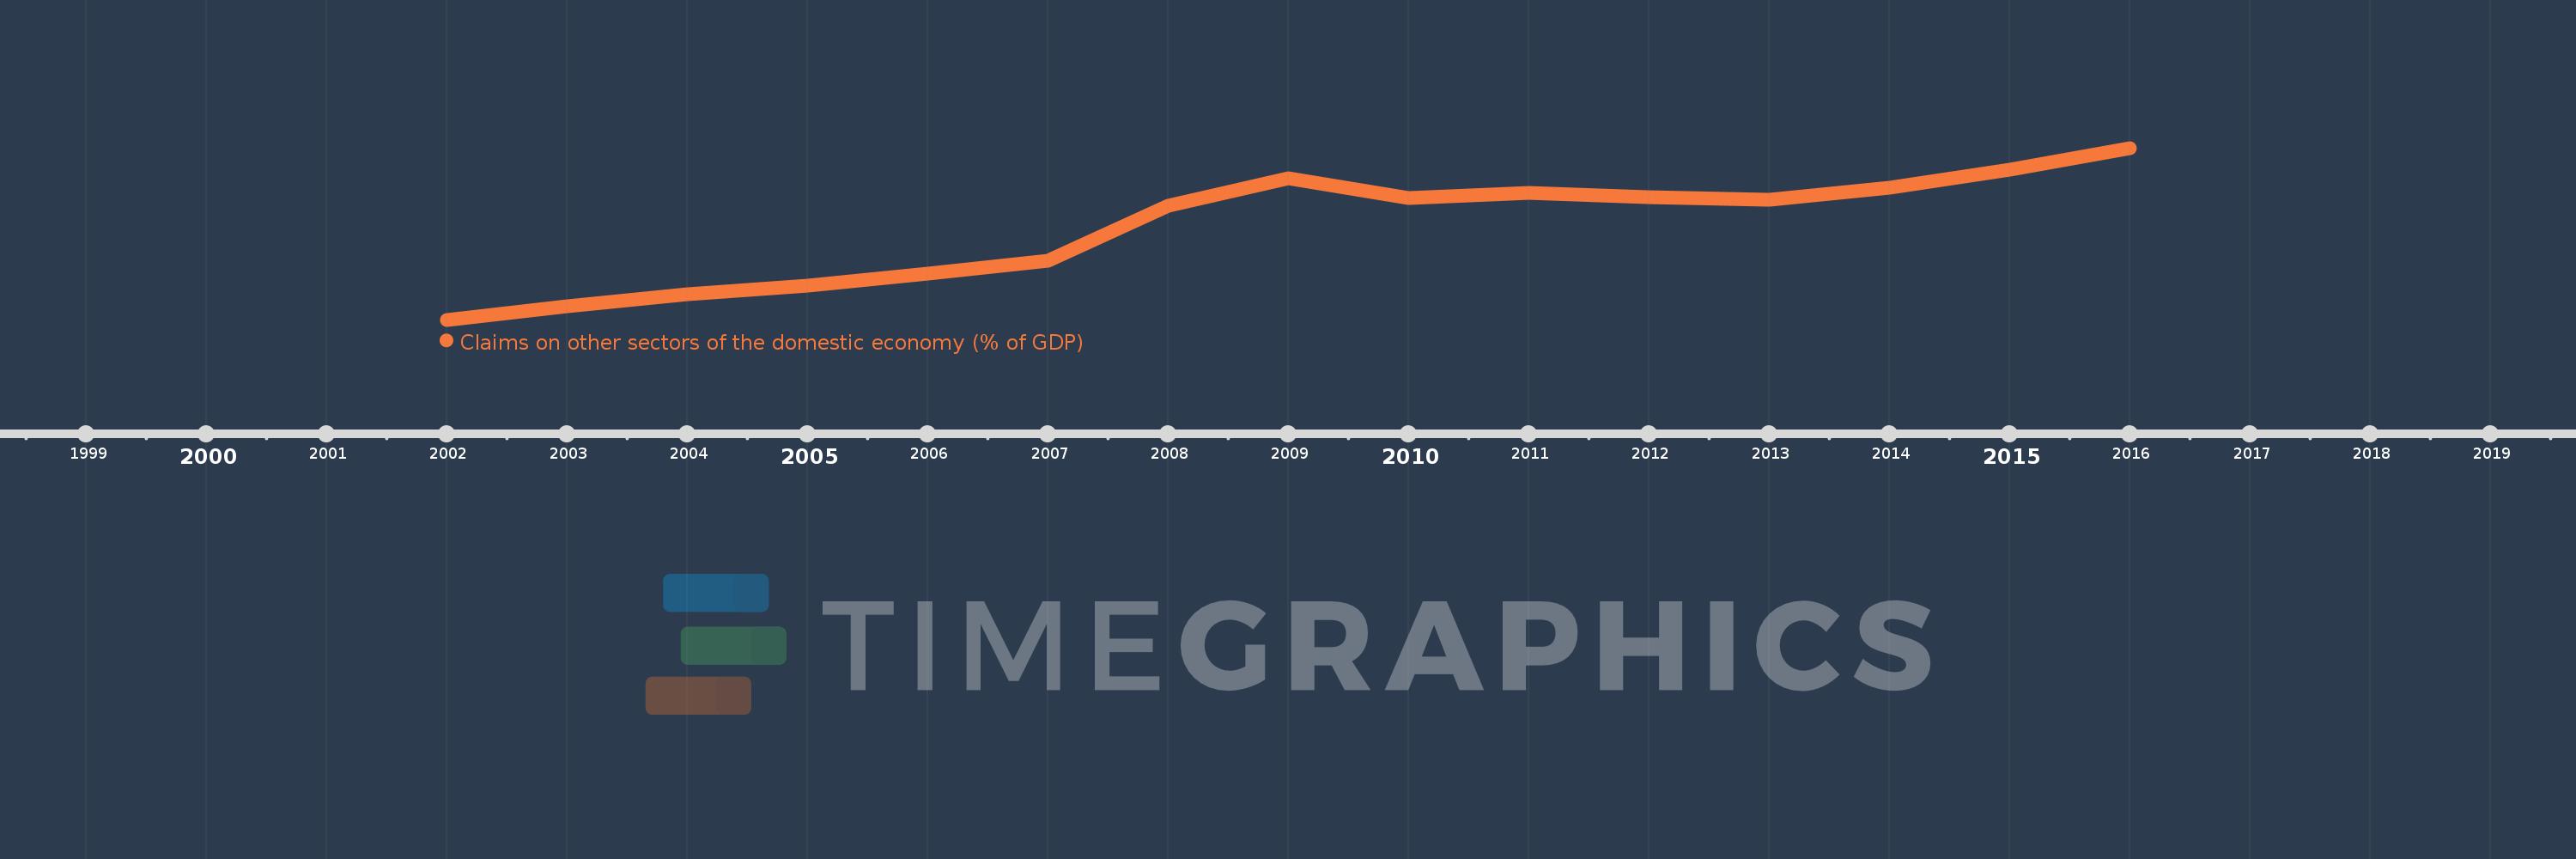
En esta escala de tiempo se presenta un gráfico de 2002 y 2016 de Australia. Los datos de 2001 están ausentes. El número de observaciones reales por fecha: 15.

Fuente (nombre):

Indicadores del desarrollo mundial

Fuente (organización):

International Monetary Fund, International Financial Statistics and data files, and World Bank and OECD GDP estimates.

Categorías:

Financial Sector

Se ha actualizado:

23 abr 2017 año

Los indicadores de los cambios de valor en los últimos años

En promedio:
137.039
Mínimo:
92.464
1 ene 2002 año
Máximo:
175.771
1 ene 2016 año
A la fecha de observación
Valor
Cambio absoluto
El cambio con respecto al valor anterior
1 ene 2002 año
92.464
+92.464
0.0%
1 ene 2003 año
99.122
+6.658
7.2%
1 ene 2004 año
105.003
+5.881
5.93%
1 ene 2005 año
109.029
+4.026
3.83%
1 ene 2006 año
115.026
+5.998
5.5%
1 ene 2007 año
120.932
+5.905
5.13%
1 ene 2008 año
147.914
+26.982
22.31%
1 ene 2009 año
160.903
+12.989
8.78%
1 ene 2010 año
151.538
-9.365
-5.82%
1 ene 2011 año
153.816
+2.279
1.5%
1 ene 2012 año
152.005
-1.812
-1.18%
1 ene 2013 año
150.535
-1.47
-0.97%
1 ene 2014 año
156.388
+5.854
3.89%
1 ene 2015 año
165.133
+8.745
5.59%
1 ene 2016 año
175.771
+10.638
6.44%

Ranking de los países por los datos estadísticos actuales