29
/es/
es
AIzaSyAYiBZKx7MnpbEhh9jyipgxe19OcubqV5w
April 1, 2024
25542
Central Europe and the Baltics
CEB
false
2
1
Claims on other sectors of the domestic economy (% of GDP)
2016,2015,2014,2013,2012,2011,2010,2009,2008,2007,2006,2005,2004,2003,2002
Download
Estadísticas Globales de la Biblioteca →Central Europe and the Baltics →

Claims on other sectors of the domestic economy (% of GDP)

Estas estadísticas en otros países:
AfghanistanAlbaniaAlgeriaAngolaAntigua and BarbudaArmeniaAustraliaAustriaAzerbaijanBangladeshBarbadosBelarusBelgiumBelizeBeninBhutanBoliviaBosnia and HerzegovinaBotswanaBrazilBrunei DarussalamBulgariaBurkina FasoBurundiCabo VerdeCambodiaCameroonCanadaCaribbean small statesCentral African RepublicCentral Europe and the BalticsChadChileColombiaComorosCongo, Dem. Rep.Congo, Rep.Costa RicaCote d'IvoireCroatiaCyprusCzech RepublicDenmarkDominicaDominican RepublicEast Asia & PacificEcuadorEgypt, Arab Rep.El SalvadorEquatorial GuineaEritreaEstoniaEuro areaEurope & Central AsiaEurope & Central Asia (excluding high income)Europe & Central Asia (IDA & IBRD countries)European UnionFijiFinlandFragile and conflict affected situationsFranceGabonGambia, TheGeorgiaGermanyGhanaGreeceGrenadaGuatemalaGuinea-BissauGuyanaHaitiHeavily indebted poor countries (HIPC)High incomeHondurasHungaryIcelandIDA blendIDA onlyIDA totalIndonesiaIraqIrelandIsraelItalyJamaicaJapanKazakhstanKenyaKorea, Rep.KosovoKuwaitKyrgyz RepublicLatin America & Caribbean Latin America & Caribbean (excluding high income)Latin America & the Caribbean (IDA & IBRD countries)LatviaLeast developed countries: UN classificationLesothoLithuaniaLow incomeLuxembourgMacao SAR, ChinaMacedonia, FYRMalaysiaMaldivesMaliMaltaMauritiusMexicoMiddle East & North AfricaMiddle East & North Africa (excluding high income)Middle East & North Africa (IDA & IBRD countries)MoldovaMongoliaMoroccoMozambiqueMyanmarNamibiaNepalNetherlandsNicaraguaNigerNigeriaNorth AmericaNorwayOECD membersOmanOther small statesPacific island small statesPakistanPanamaPapua New GuineaParaguayPhilippinesPolandPortugalPost-demographic dividendPre-demographic dividendQatarRomaniaRussian FederationRwandaSamoaSao Tome and PrincipeSenegalSerbiaSeychellesSierra LeoneSlovak RepublicSloveniaSmall statesSolomon IslandsSouth AfricaSouth SudanSpainSri LankaSt. Kitts and NevisSt. LuciaSt. Vincent and the GrenadinesSub-Saharan Africa Sub-Saharan Africa (excluding high income)Sub-Saharan Africa (IDA & IBRD countries)SudanSurinameSwazilandSwedenSyrian Arab RepublicTajikistanTanzaniaThailandTimor-LesteTogoTongaTrinidad and TobagoTurkeyUgandaUkraineUnited Arab EmiratesUnited StatesUruguayVanuatuVenezuela, RBWest Bank and GazaWorldZambia
línea de tiempo (timeline):
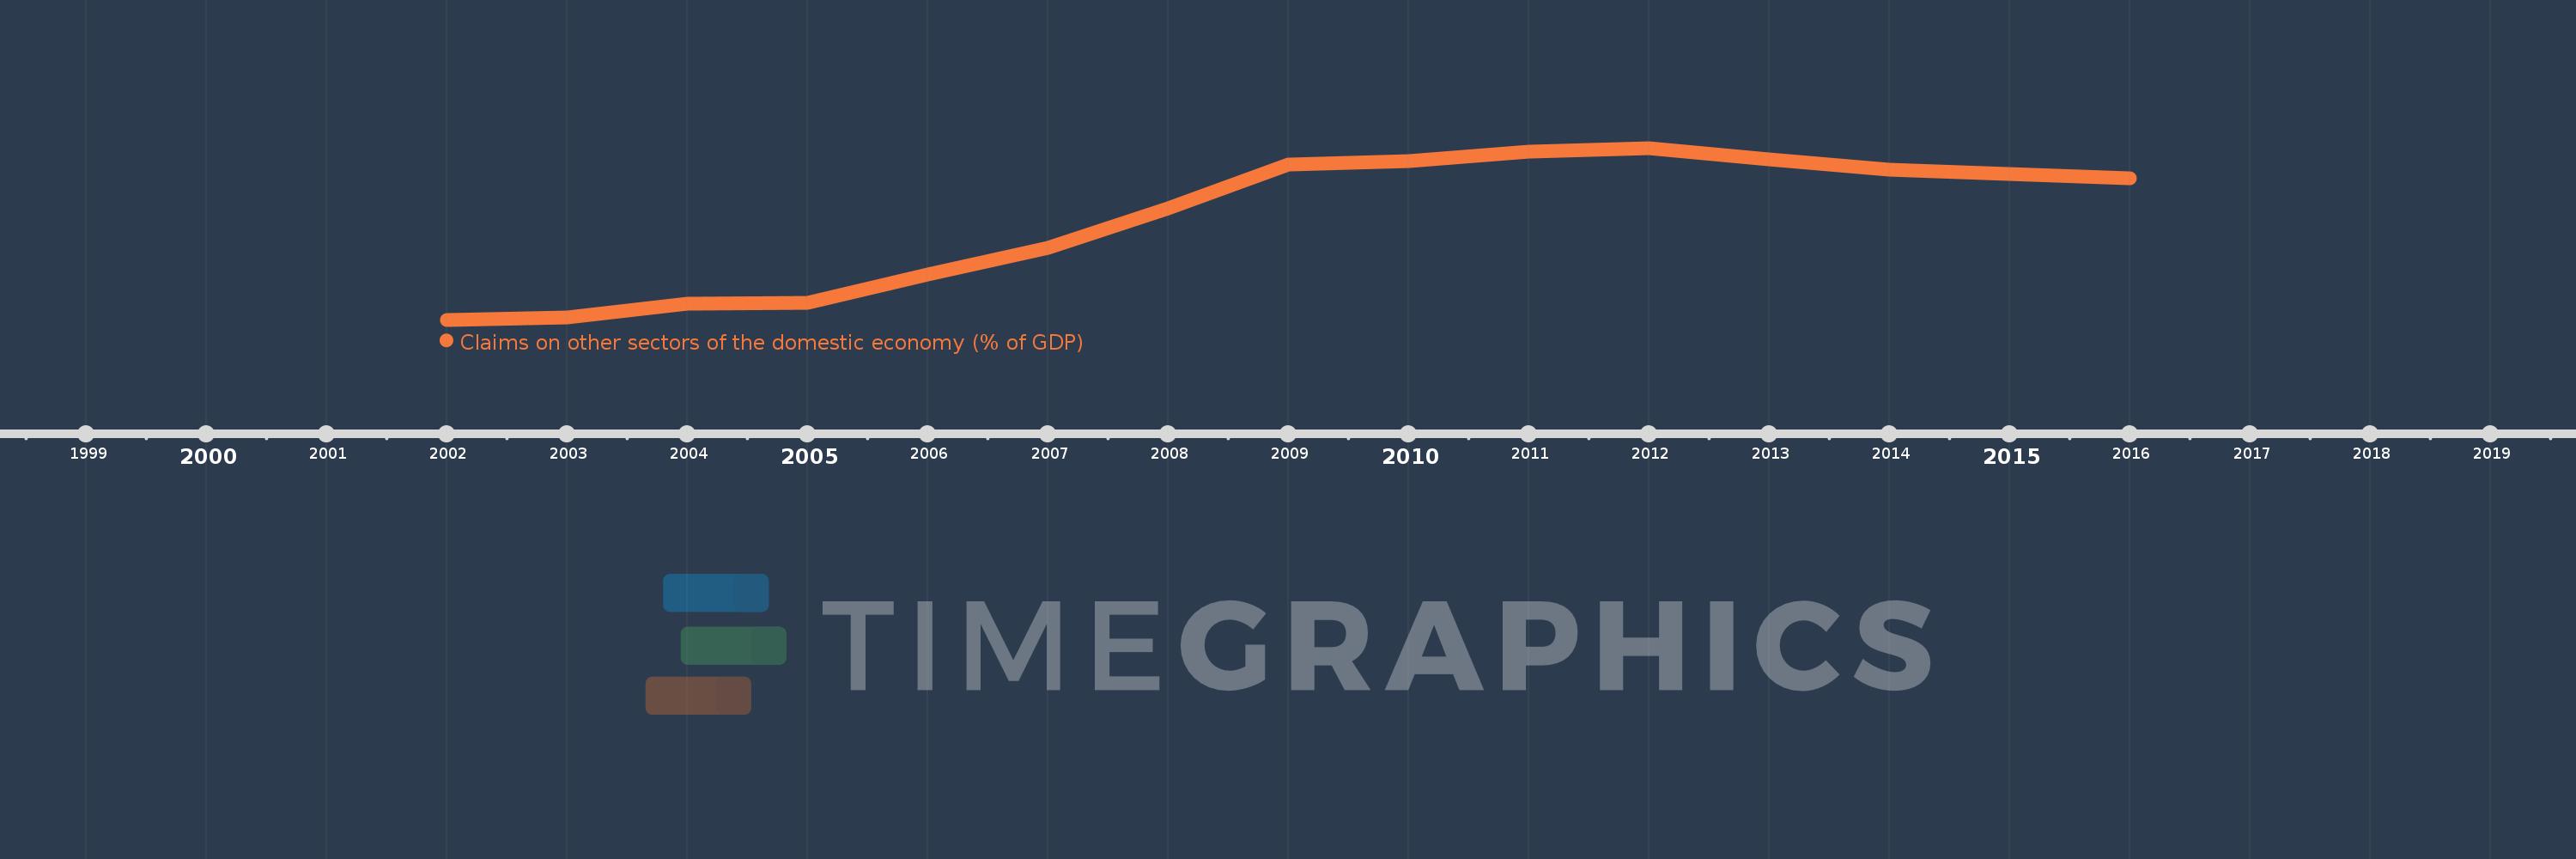
En esta escala de tiempo se presenta un gráfico de 2002 y 2016 de Central Europe and the Baltics. Los datos de 2001 están ausentes. El número de observaciones reales por fecha: 15.
Fuente (nombre):
Indicadores del desarrollo mundial
Fuente (organización):
International Monetary Fund, International Financial Statistics and data files, and World Bank and OECD GDP estimates.
Categorías:
Financial Sector
Se ha actualizado:
23 abr 2017 año
Los indicadores de los cambios de valor en los últimos años
En promedio:
47.432
Mínimo:
29.617
1 ene 2002 año
Máximo:
59.921
1 ene 2012 año
A la fecha de observación
Valor
Cambio absoluto
El cambio con respecto al valor anterior
1 ene 2002 año
29.617
+29.617
0.0%
1 ene 2003 año
30.07
+0.453
1.53%
1 ene 2004 año
32.525
+2.455
8.17%
1 ene 2005 año
32.594
+0.068
0.21%
1 ene 2006 año
37.668
+5.074
15.57%
1 ene 2007 año
42.248
+4.581
12.16%
1 ene 2008 año
49.26
+7.011
16.6%
1 ene 2009 año
56.921
+7.661
15.55%
1 ene 2010 año
57.538
+0.617
1.08%
1 ene 2011 año
59.228
+1.69
2.94%
1 ene 2012 año
59.921
+0.693
1.17%
1 ene 2013 año
57.888
-2.034
-3.39%
1 ene 2014 año
56.038
-1.85
-3.2%
1 ene 2015 año
55.369
-0.669
-1.19%
1 ene 2016 año
54.592
-0.778
-1.4%
Ranking de los países por los datos estadísticos actuales

Comentarios:

Enviar
PremiumAbout & FeedbackAcuerdoPrivacidad
logo
© 2022 Selected Technologies LLC – Morgan Hill, California