33
/es/
AIzaSyAYiBZKx7MnpbEhh9jyipgxe19OcubqV5w
August 1, 2025
67710
Angola
AGO
true
2
1
Final consumption expenditure (current US$)
2016,2015,2014,2013,2012,2011,2010,2009,2008,2007,2006,2005,2004,2003,2002,2001,1995,1991,1990,1989,1988,1987,1986
Download
Estadísticas Globales de la Biblioteca →Angola →

Final consumption expenditure (current US$)

Estas estadísticas en otros países:

AfghanistanAlbaniaAlgeriaAngolaAntigua and BarbudaArgentinaArmeniaArubaAustraliaAustriaAzerbaijanBahamas, TheBahrainBangladeshBarbadosBelarusBelgiumBelizeBeninBermudaBhutanBoliviaBosnia and HerzegovinaBotswanaBrazilBrunei DarussalamBulgariaBurkina FasoBurundiCabo VerdeCambodiaCameroonCanadaCentral African RepublicChadChileChinaColombiaComorosCongo, Dem. Rep.Congo, Rep.Costa RicaCote d'IvoireCroatiaCubaCyprusCzech RepublicDenmarkDjiboutiDominicaDominican RepublicEcuadorEgypt, Arab Rep.El SalvadorEquatorial GuineaEritreaEstoniaEthiopiaFaroe IslandsFijiFinlandFranceGabonGambia, TheGeorgiaGermanyGhanaGreeceGrenadaGuatemalaGuineaGuinea-BissauGuyanaHaitiHondurasHong Kong SAR, ChinaHungaryIcelandIndiaIndonesiaIran, Islamic Rep.IrelandIsraelItalyJamaicaJapanJordanKazakhstanKenyaKiribatiKorea, Rep.KosovoKuwaitKyrgyz RepublicLao PDRLatviaLebanonLesothoLiberiaLibyaLithuaniaLuxembourgMacao SAR, ChinaMacedonia, FYRMadagascarMalawiMalaysiaMaliMaltaMauritaniaMauritiusMexicoMicronesia, Fed. Sts.MoldovaMongoliaMontenegroMoroccoMozambiqueNamibiaNepalNetherlandsNew CaledoniaNew ZealandNicaraguaNigerNigeriaNorwayOmanPakistanPanamaPapua New GuineaParaguayPeruPhilippinesPolandPortugalPuerto RicoQatarRomaniaRussian FederationRwandaSaudi ArabiaSenegalSerbiaSeychellesSierra LeoneSingaporeSlovak RepublicSloveniaSolomon IslandsSomaliaSouth AfricaSouth SudanSpainSri LankaSt. Kitts and NevisSt. LuciaSt. Vincent and the GrenadinesSudanSurinameSwazilandSwedenSwitzerlandSyrian Arab RepublicTajikistanTanzaniaThailandTimor-LesteTogoTongaTrinidad and TobagoTunisiaTurkeyUgandaUkraineUnited Arab EmiratesUnited KingdomUnited StatesUruguayUzbekistanVanuatuVenezuela, RBVietnamWest Bank and GazaYemen, Rep.ZambiaZimbabwe

línea de tiempo (timeline):

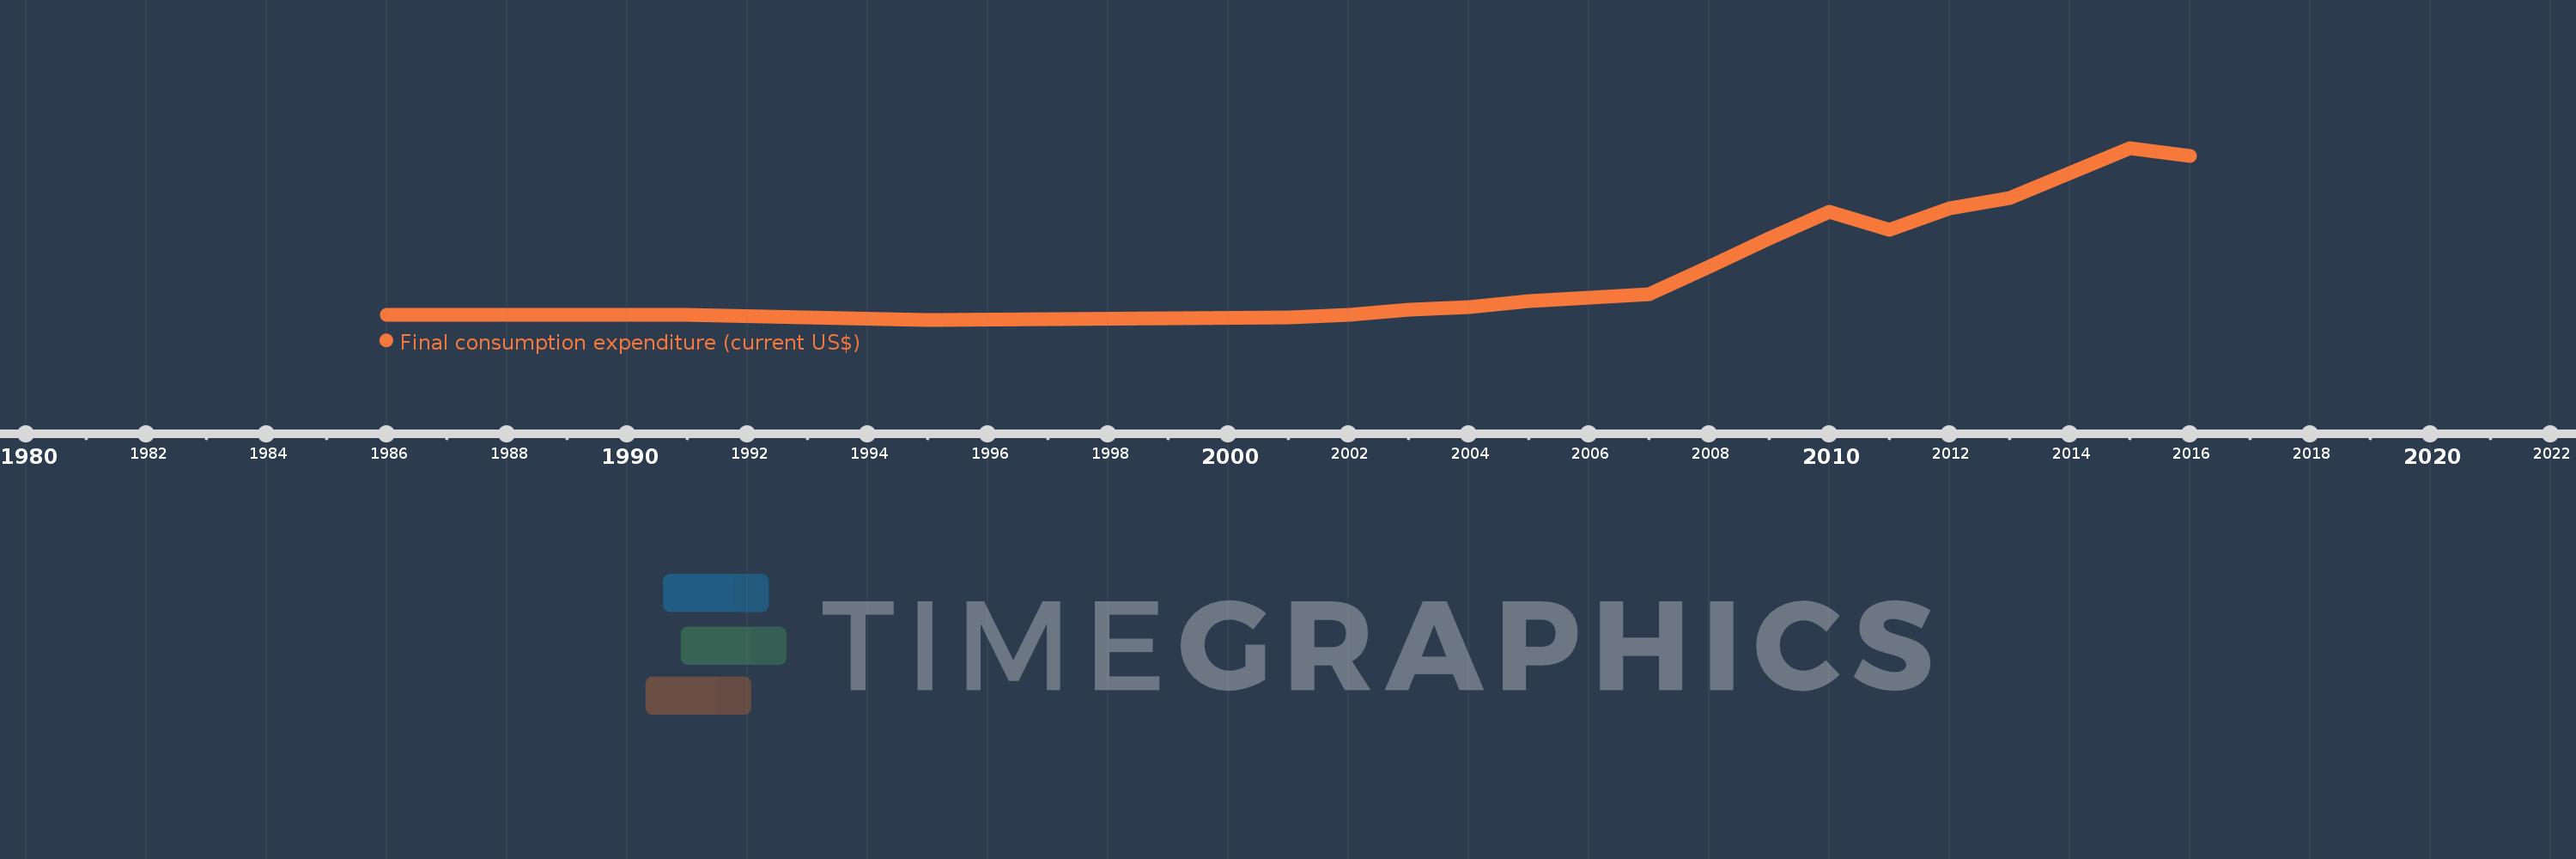
En esta escala de tiempo se presenta un gráfico de 1986 y 2016 de Angola. Los datos de 1985 están ausentes. El número de observaciones reales por fecha: 23.

Fuente (nombre):

Indicadores del desarrollo mundial

Fuente (organización):

World Bank national accounts data, and OECD National Accounts data files.

Categorías:

Economy & Growth

Se ha actualizado:

23 abr 2017 año

Los indicadores de los cambios de valor en los últimos años

En promedio:
32.589 bn
Mínimo:
4.18 bn
1 ene 1995 año
Máximo:
99.992 bn
1 ene 2015 año
A la fecha de observación
Valor
Cambio absoluto
El cambio con respecto al valor anterior
1 ene 1986 año
6.689 bn
+6.689 bn
0.0%
1 ene 1987 año
6.689 bn
0.0
0.0%
1 ene 1988 año
6.689 bn
0.0
0.0%
1 ene 1989 año
6.689 bn
0.0
0.0%
1 ene 1990 año
6.689 bn
0.0
0.0%
1 ene 1991 año
6.689 bn
0.0
0.0%
1 ene 1995 año
4.18 bn
-2.509 bn
-37.51%
1 ene 2001 año
5.286 bn
+1.106 bn
26.47%
1 ene 2002 año
6.786 bn
+1.5 bn
28.37%
1 ene 2003 año
9.568 bn
+2.781 bn
40.99%
1 ene 2004 año
11.459 bn
+1.892 bn
19.77%
1 ene 2005 año
14.677 bn
+3.218 bn
28.08%
1 ene 2006 año
16.613 bn
+1.936 bn
13.19%
1 ene 2007 año
18.312 bn
+1.699 bn
10.23%
1 ene 2008 año
33.883 bn
+15.571 bn
85.03%
1 ene 2009 año
49.403 bn
+15.52 bn
45.81%
1 ene 2010 año
64.374 bn
+14.97 bn
30.3%
1 ene 2011 año
54.538 bn
-9.836 bn
-15.28%
1 ene 2012 año
66.535 bn
+11.997 bn
22.0%
1 ene 2013 año
72.118 bn
+5.583 bn
8.39%
1 ene 2014 año
86.18 bn
+14.063 bn
19.5%
1 ene 2015 año
99.992 bn
+13.812 bn
16.03%
1 ene 2016 año
95.515 bn
-4.477 bn
-4.48%

Ranking de los países por los datos estadísticos actuales