33
/es/
AIzaSyAYiBZKx7MnpbEhh9jyipgxe19OcubqV5w
August 1, 2025
273538
Ukraine
UKR
true
2
1
Final consumption expenditure (current US$)
2016,2015,2014,2013,2012,2011,2010,2009,2008,2007,2006,2005,2004,2003,2002,2001,2000,1999,1998,1997,1996,1995,1994,1993
Download
Estadísticas Globales de la Biblioteca →Ukraine →

Final consumption expenditure (current US$)

Estas estadísticas en otros países:

AfghanistanAlbaniaAlgeriaAngolaAntigua and BarbudaArgentinaArmeniaArubaAustraliaAustriaAzerbaijanBahamas, TheBahrainBangladeshBarbadosBelarusBelgiumBelizeBeninBermudaBhutanBoliviaBosnia and HerzegovinaBotswanaBrazilBrunei DarussalamBulgariaBurkina FasoBurundiCabo VerdeCambodiaCameroonCanadaCentral African RepublicChadChileChinaColombiaComorosCongo, Dem. Rep.Congo, Rep.Costa RicaCote d'IvoireCroatiaCubaCyprusCzech RepublicDenmarkDjiboutiDominicaDominican RepublicEcuadorEgypt, Arab Rep.El SalvadorEquatorial GuineaEritreaEstoniaEthiopiaFaroe IslandsFijiFinlandFranceGabonGambia, TheGeorgiaGermanyGhanaGreeceGrenadaGuatemalaGuineaGuinea-BissauGuyanaHaitiHondurasHong Kong SAR, ChinaHungaryIcelandIndiaIndonesiaIran, Islamic Rep.IrelandIsraelItalyJamaicaJapanJordanKazakhstanKenyaKiribatiKorea, Rep.KosovoKuwaitKyrgyz RepublicLao PDRLatviaLebanonLesothoLiberiaLibyaLithuaniaLuxembourgMacao SAR, ChinaMacedonia, FYRMadagascarMalawiMalaysiaMaliMaltaMauritaniaMauritiusMexicoMicronesia, Fed. Sts.MoldovaMongoliaMontenegroMoroccoMozambiqueNamibiaNepalNetherlandsNew CaledoniaNew ZealandNicaraguaNigerNigeriaNorwayOmanPakistanPanamaPapua New GuineaParaguayPeruPhilippinesPolandPortugalPuerto RicoQatarRomaniaRussian FederationRwandaSaudi ArabiaSenegalSerbiaSeychellesSierra LeoneSingaporeSlovak RepublicSloveniaSolomon IslandsSomaliaSouth AfricaSouth SudanSpainSri LankaSt. Kitts and NevisSt. LuciaSt. Vincent and the GrenadinesSudanSurinameSwazilandSwedenSwitzerlandSyrian Arab RepublicTajikistanTanzaniaThailandTimor-LesteTogoTongaTrinidad and TobagoTunisiaTurkeyUgandaUkraineUnited Arab EmiratesUnited KingdomUnited StatesUruguayUzbekistanVanuatuVenezuela, RBVietnamWest Bank and GazaYemen, Rep.ZambiaZimbabwe

línea de tiempo (timeline):

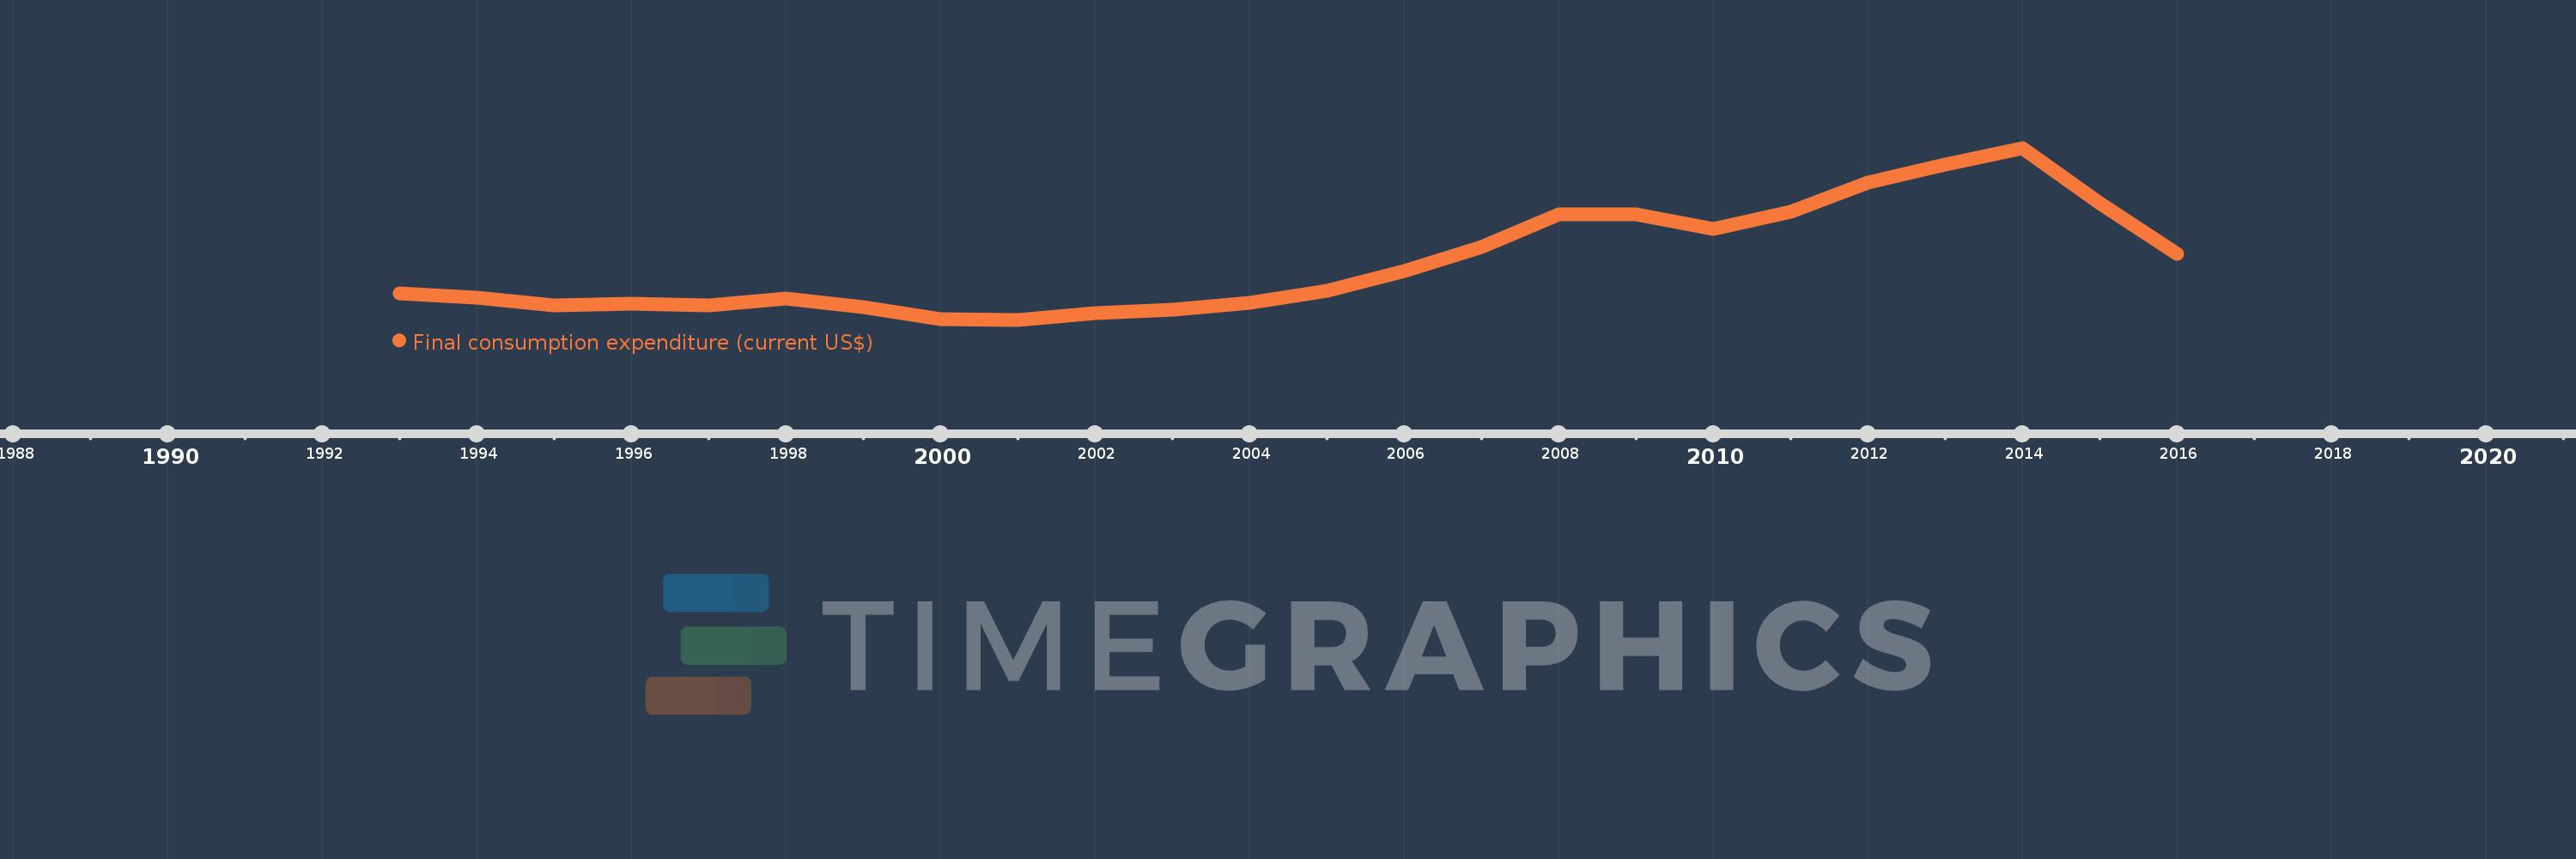
En esta escala de tiempo se presenta un gráfico de 1993 y 2016 de Ukraine. Los datos de 1992 están ausentes. El número de observaciones reales por fecha: 24.

Fuente (nombre):

Indicadores del desarrollo mundial

Fuente (organización):

World Bank national accounts data, and OECD National Accounts data files.

Categorías:

Economy & Growth

Se ha actualizado:

23 abr 2017 año

Los indicadores de los cambios de valor en los últimos años

En promedio:
70.959 bn
Mínimo:
23.525 bn
1 ene 2001 año
Máximo:
166.35 bn
1 ene 2014 año
A la fecha de observación
Valor
Cambio absoluto
El cambio con respecto al valor anterior
1 ene 1993 año
45.694 bn
+45.694 bn
0.0%
1 ene 1994 año
42.002 bn
-3.692 bn
-8.08%
1 ene 1995 año
35.643 bn
-6.36 bn
-15.14%
1 ene 1996 año
36.836 bn
+1.193 bn
3.35%
1 ene 1997 año
35.594 bn
-1.242 bn
-3.37%
1 ene 1998 año
40.929 bn
+5.335 bn
14.99%
1 ene 1999 año
34.117 bn
-6.812 bn
-16.64%
1 ene 2000 año
24.327 bn
-9.79 bn
-28.69%
1 ene 2001 año
23.525 bn
-801.945 millones
-3.3%
1 ene 2002 año
29.103 bn
+5.578 bn
23.71%
1 ene 2003 año
31.976 bn
+2.873 bn
9.87%
1 ene 2004 año
37.809 bn
+5.833 bn
18.24%
1 ene 2005 año
47.52 bn
+9.711 bn
25.68%
1 ene 2006 año
63.785 bn
+16.265 bn
34.23%
1 ene 2007 año
84.14 bn
+20.355 bn
31.91%
1 ene 2008 año
111.013 bn
+26.874 bn
31.94%
1 ene 2009 año
111.369 bn
+355.464 millones
0.32%
1 ene 2010 año
99.192 bn
-12.177 bn
-10.93%
1 ene 2011 año
113.108 bn
+13.916 bn
14.03%
1 ene 2012 año
137.335 bn
+24.227 bn
21.42%
1 ene 2013 año
152.817 bn
+15.482 bn
11.27%
1 ene 2014 año
166.35 bn
+13.532 bn
8.86%
1 ene 2015 año
120.299 bn
-46.05 bn
-27.68%
1 ene 2016 año
78.538 bn
-41.761 bn
-34.71%

Ranking de los países por los datos estadísticos actuales