33
/es/
AIzaSyAYiBZKx7MnpbEhh9jyipgxe19OcubqV5w
August 1, 2025
60110
Sub-Saharan Africa (excluding high income)
SSA
false
2
1
Net official flows from UN agencies, IAEA (current US$)
2015,2014,2013,2012,2011,2010,2009,2008,2007
Download
Estadísticas Globales de la Biblioteca →Sub-Saharan Africa (excluding high income) →

Net official flows from UN agencies, IAEA (current US$)

Estas estadísticas en otros países:

AfghanistanAlbaniaAlgeriaAngolaArab WorldArgentinaArmeniaAzerbaijanBangladeshBelarusBelizeBeninBoliviaBosnia and HerzegovinaBotswanaBrazilBurkina FasoBurundiCambodiaCameroonCaribbean small statesCentral African RepublicCentral Europe and the BalticsChadChileChinaColombiaCongo, Dem. Rep.Costa RicaCote d'IvoireCroatiaCubaDominican RepublicEast Asia & PacificEast Asia & Pacific (excluding high income)East Asia & Pacific (IDA & IBRD countries)EcuadorEgypt, Arab Rep.El SalvadorEritreaEthiopiaEurope & Central AsiaEurope & Central Asia (excluding high income)Europe & Central Asia (IDA & IBRD countries)European UnionFragile and conflict affected situationsGabonGeorgiaGhanaGuatemalaHaitiHeavily indebted poor countries (HIPC)High incomeHondurasIBRD onlyIDA & IBRD totalIDA blendIDA onlyIDA totalIndonesiaIran, Islamic Rep.IraqJamaicaJordanKazakhstanKenyaKyrgyz RepublicLao PDRLatin America & Caribbean Latin America & Caribbean (excluding high income)Latin America & the Caribbean (IDA & IBRD countries)Least developed countries: UN classificationLebanonLesothoLibyaLow & middle incomeLow incomeLower middle incomeMacedonia, FYRMadagascarMalawiMalaysiaMaliMauritaniaMauritiusMexicoMiddle East & North AfricaMiddle East & North Africa (excluding high income)Middle East & North Africa (IDA & IBRD countries)Middle incomeMoldovaMongoliaMontenegroMoroccoMozambiqueMyanmarNamibiaNepalNicaraguaNigerNigeriaNorth AmericaOECD membersOmanOther small statesPacific island small statesPakistanPalauPanamaParaguayPeruPhilippinesSenegalSerbiaSeychellesSierra LeoneSmall statesSouth AfricaSouth AsiaSouth Asia (IDA & IBRD)Sri LankaSub-Saharan Africa Sub-Saharan Africa (excluding high income)Sub-Saharan Africa (IDA & IBRD countries)SudanSyrian Arab RepublicTajikistanTanzaniaThailandTogoTunisiaTurkeyUgandaUkraineUpper middle incomeUruguayUzbekistanVenezuela, RBVietnamWest Bank and GazaWorldYemen, Rep.ZambiaZimbabwe

línea de tiempo (timeline):

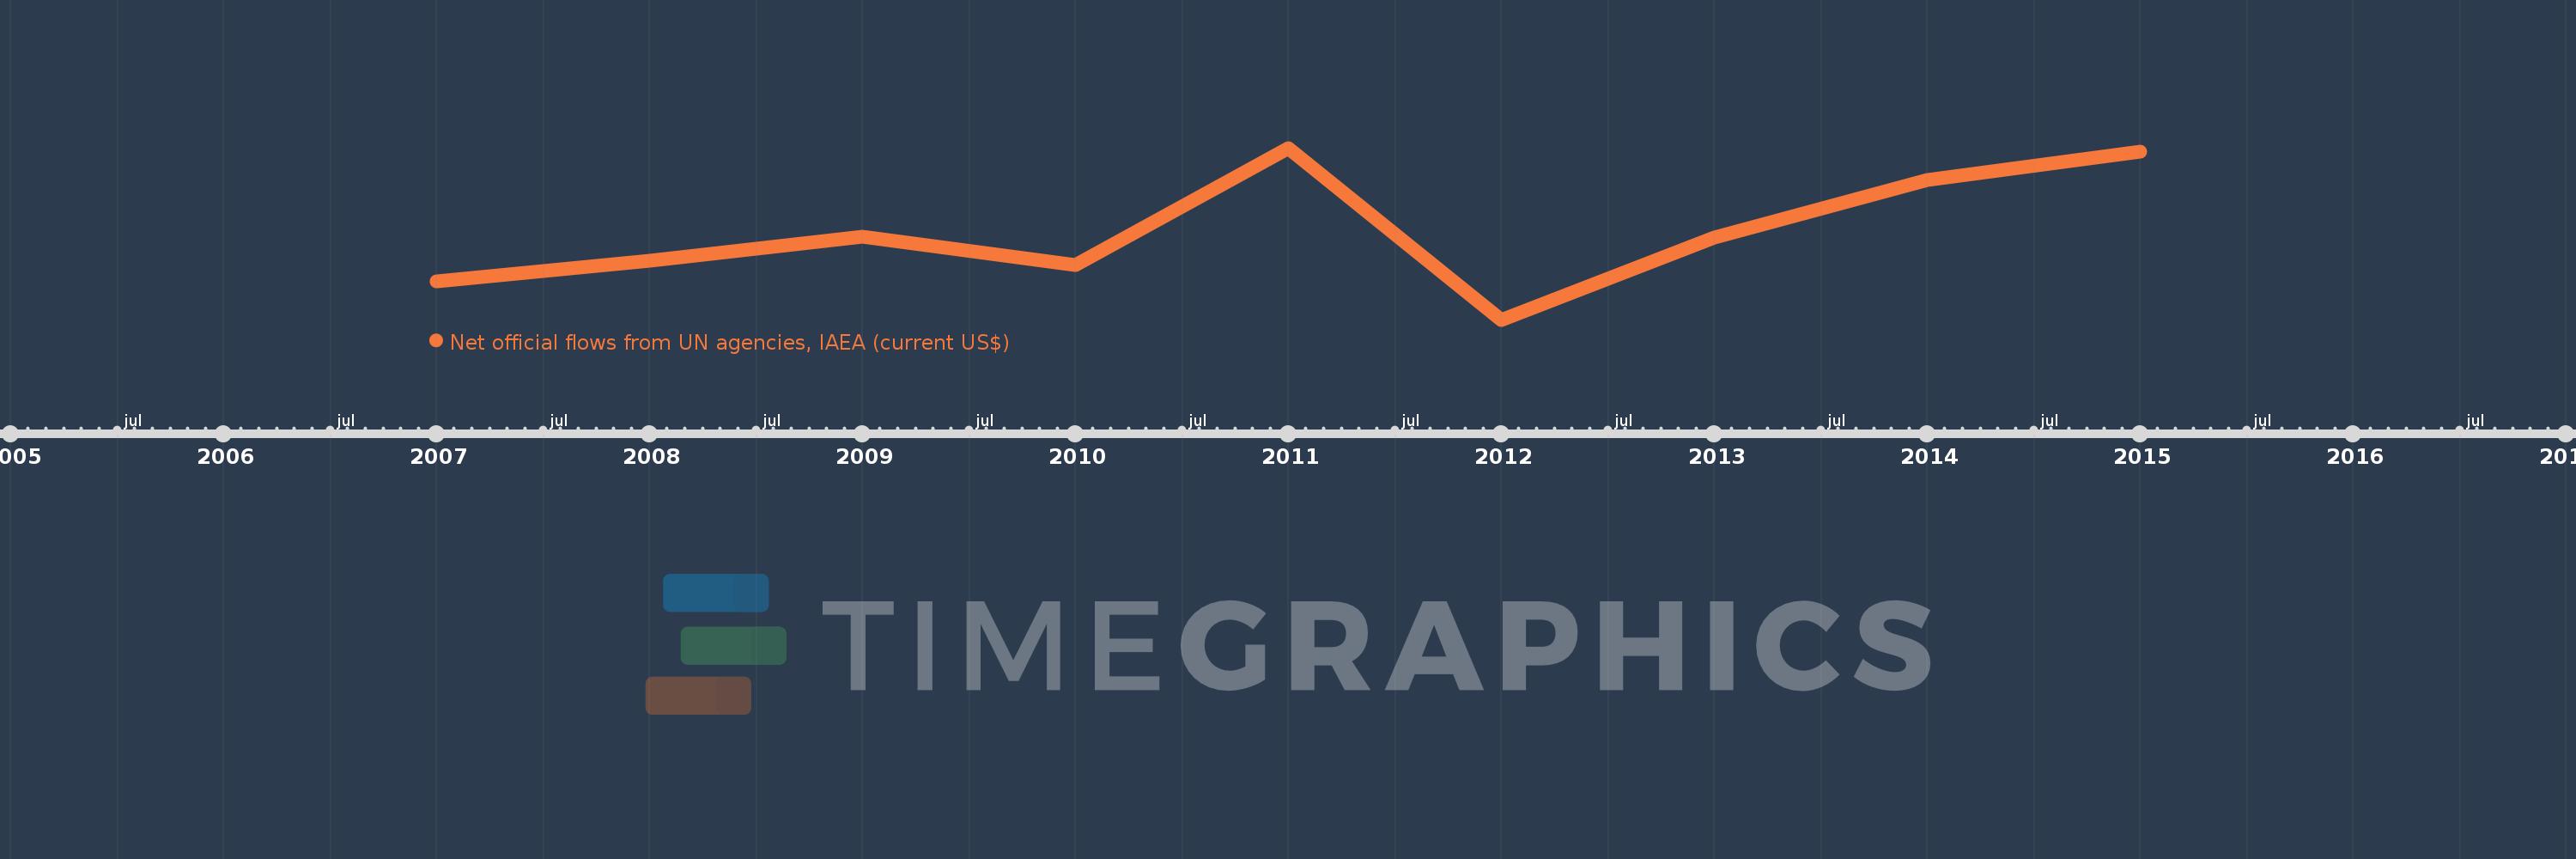
En esta escala de tiempo se presenta un gráfico de 2007 y 2015 de Sub-Saharan Africa (excluding high income). Los datos de 2006 están ausentes. El número de observaciones reales por fecha: 9.

Fuente (nombre):

Indicadores del desarrollo mundial

Fuente (organización):

Development Assistance Committee of the Organisation for Economic Co-operation and Development, Geographical Distribution of Financial Flows to Developing Countries, Development Co-operation Report, and International Development Statistics database. Data are available online at: www.oecd.org/dac/stats/idsonline.

Categorías:

Aid Effectiveness

Se ha actualizado:

23 abr 2017 año

Los indicadores de los cambios de valor en los últimos años

En promedio:
20.469 millones
Mínimo:
16.74 millones
1 ene 2012 año
Máximo:
23.98 millones
1 ene 2011 año
A la fecha de observación
Valor
Cambio absoluto
El cambio con respecto al valor anterior
1 ene 2007 año
18.35 millones
+18.35 millones
0.0%
1 ene 2008 año
19.23 millones
+880.0 mil
4.8%
1 ene 2009 año
20.23 millones
+1000.0 mil
5.2%
1 ene 2010 año
19.03 millones
-1.2 millones
-5.93%
1 ene 2011 año
23.98 millones
+4.95 millones
26.01%
1 ene 2012 año
16.74 millones
-7.24 millones
-30.19%
1 ene 2013 año
20.21 millones
+3.47 millones
20.73%
1 ene 2014 año
22.63 millones
+2.42 millones
11.97%
1 ene 2015 año
23.82 millones
+1.19 millones
5.26%

Ranking de los países por los datos estadísticos actuales