29
/es/
es
AIzaSyAYiBZKx7MnpbEhh9jyipgxe19OcubqV5w
April 1, 2024
203312
Mozambique
MOZ
true
2
1
Net official flows from UN agencies, IAEA (current US$)
2015,2014,2013,2012,2011,2010
Download
Estadísticas Globales de la Biblioteca →Mozambique →

Net official flows from UN agencies, IAEA (current US$)

Estas estadísticas en otros países:
AfghanistanAlbaniaAlgeriaAngolaArab WorldArgentinaArmeniaAzerbaijanBangladeshBelarusBelizeBeninBoliviaBosnia and HerzegovinaBotswanaBrazilBurkina FasoBurundiCambodiaCameroonCaribbean small statesCentral African RepublicCentral Europe and the BalticsChadChileChinaColombiaCongo, Dem. Rep.Costa RicaCote d'IvoireCroatiaCubaDominican RepublicEast Asia & PacificEast Asia & Pacific (excluding high income)East Asia & Pacific (IDA & IBRD countries)EcuadorEgypt, Arab Rep.El SalvadorEritreaEthiopiaEurope & Central AsiaEurope & Central Asia (excluding high income)Europe & Central Asia (IDA & IBRD countries)European UnionFragile and conflict affected situationsGabonGeorgiaGhanaGuatemalaHaitiHeavily indebted poor countries (HIPC)High incomeHondurasIBRD onlyIDA & IBRD totalIDA blendIDA onlyIDA totalIndonesiaIran, Islamic Rep.IraqJamaicaJordanKazakhstanKenyaKyrgyz RepublicLao PDRLatin America & Caribbean Latin America & Caribbean (excluding high income)Latin America & the Caribbean (IDA & IBRD countries)Least developed countries: UN classificationLebanonLesothoLibyaLow & middle incomeLow incomeLower middle incomeMacedonia, FYRMadagascarMalawiMalaysiaMaliMauritaniaMauritiusMexicoMiddle East & North AfricaMiddle East & North Africa (excluding high income)Middle East & North Africa (IDA & IBRD countries)Middle incomeMoldovaMongoliaMontenegroMoroccoMozambiqueMyanmarNamibiaNepalNicaraguaNigerNigeriaNorth AmericaOECD membersOmanOther small statesPacific island small statesPakistanPalauPanamaParaguayPeruPhilippinesSenegalSerbiaSeychellesSierra LeoneSmall statesSouth AfricaSouth AsiaSouth Asia (IDA & IBRD)Sri LankaSub-Saharan Africa Sub-Saharan Africa (excluding high income)Sub-Saharan Africa (IDA & IBRD countries)SudanSyrian Arab RepublicTajikistanTanzaniaThailandTogoTunisiaTurkeyUgandaUkraineUpper middle incomeUruguayUzbekistanVenezuela, RBVietnamWest Bank and GazaWorldYemen, Rep.ZambiaZimbabwe
línea de tiempo (timeline):
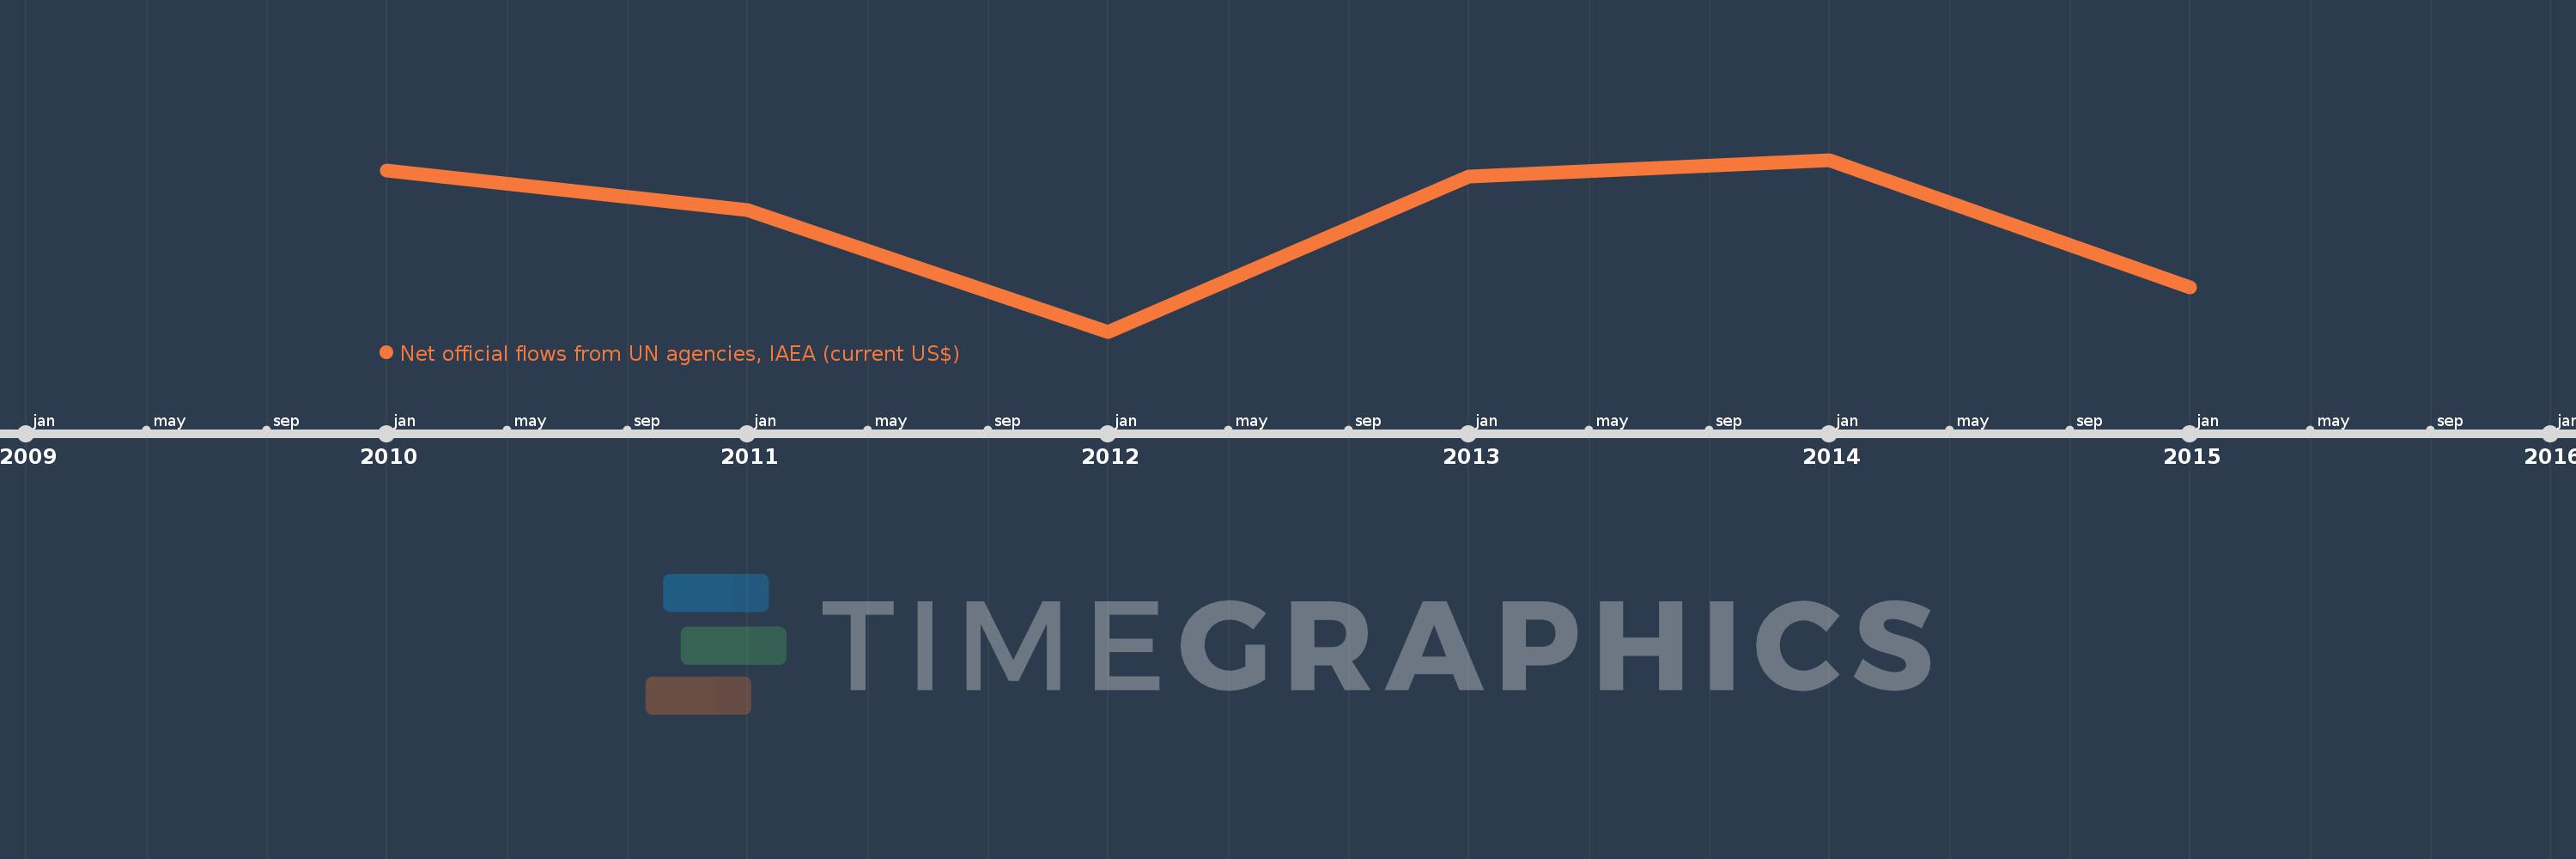
En esta escala de tiempo se presenta un gráfico de 2010 y 2015 de Mozambique. Los datos de 2009 están ausentes. El número de observaciones reales por fecha: 6.
Fuente (nombre):
Indicadores del desarrollo mundial
Fuente (organización):
Development Assistance Committee of the Organisation for Economic Co-operation and Development, Geographical Distribution of Financial Flows to Developing Countries, Development Co-operation Report, and International Development Statistics database. Data are available online at: www.oecd.org/dac/stats/idsonline.
Categorías:
Aid Effectiveness
Se ha actualizado:
23 abr 2017 año
Los indicadores de los cambios de valor en los últimos años
En promedio:
266.667 mil
Mínimo:
70.0 mil
1 ene 2012 año
Máximo:
380.0 mil
1 ene 2014 año
A la fecha de observación
Valor
Cambio absoluto
El cambio con respecto al valor anterior
1 ene 2010 año
360.0 mil
+360.0 mil
0.0%
1 ene 2011 año
290.0 mil
-70.0 mil
-19.44%
1 ene 2012 año
70.0 mil
-220.0 mil
-75.86%
1 ene 2013 año
350.0 mil
+280.0 mil
400.0%
1 ene 2014 año
380.0 mil
+30.0 mil
8.57%
1 ene 2015 año
150.0 mil
-230.0 mil
-60.53%
Ranking de los países por los datos estadísticos actuales

Comentarios:

Enviar
PremiumAbout & FeedbackAcuerdoPrivacidad
logo
© 2022 Selected Technologies LLC – Morgan Hill, California