29
/es/
es
AIzaSyAYiBZKx7MnpbEhh9jyipgxe19OcubqV5w
April 1, 2024
56497
Small states
SST
false
2
1
Newborns protected against tetanus (%)
2016,2015,2014,2013,2012,2011,2010,2009,2008,2007,2006,2005,2004,2003,2002,2001
Download
Estadísticas Globales de la Biblioteca →Small states →

Newborns protected against tetanus (%)

Estas estadísticas en otros países:
AfghanistanAlbaniaAlgeriaAngolaArab WorldBahamas, TheBahrainBangladeshBelizeBeninBhutanBoliviaBotswanaBrazilBrunei DarussalamBurkina FasoBurundiCabo VerdeCambodiaCameroonCaribbean small statesCentral African RepublicChadColombiaComorosCongo, Dem. Rep.Congo, Rep.Cote d'IvoireDjiboutiDominican RepublicEarly-demographic dividendEcuadorEgypt, Arab Rep.El SalvadorEquatorial GuineaEritreaEthiopiaFijiFragile and conflict affected situationsGabonGambia, TheGhanaGuatemalaGuineaGuinea-BissauGuyanaHaitiHeavily indebted poor countries (HIPC)HondurasIDA & IBRD totalIDA blendIDA onlyIDA totalIndiaIndonesiaIran, Islamic Rep.IraqJamaicaJordanKenyaKiribatiKorea, Dem. People’s Rep.KuwaitLao PDRLatin America & Caribbean Latin America & Caribbean (excluding high income)Latin America & the Caribbean (IDA & IBRD countries)Least developed countries: UN classificationLesothoLiberiaLow & middle incomeLow incomeLower middle incomeMadagascarMalawiMalaysiaMaldivesMaliMauritaniaMauritiusMexicoMiddle East & North AfricaMiddle East & North Africa (excluding high income)Middle East & North Africa (IDA & IBRD countries)Middle incomeMoroccoMozambiqueMyanmarNamibiaNepalNicaraguaNigerNigeriaOmanOther small statesPacific island small statesPakistanPapua New GuineaParaguayPeruPhilippinesPre-demographic dividendRwandaSao Tome and PrincipeSenegalSeychellesSierra LeoneSmall statesSolomon IslandsSomaliaSouth AfricaSouth AsiaSouth Asia (IDA & IBRD)South SudanSri LankaSub-Saharan Africa Sub-Saharan Africa (excluding high income)Sub-Saharan Africa (IDA & IBRD countries)SudanSurinameSwazilandSyrian Arab RepublicTanzaniaThailandTimor-LesteTogoTunisiaTurkeyUgandaVanuatuVenezuela, RBVietnamYemen, Rep.ZambiaZimbabwe
línea de tiempo (timeline):
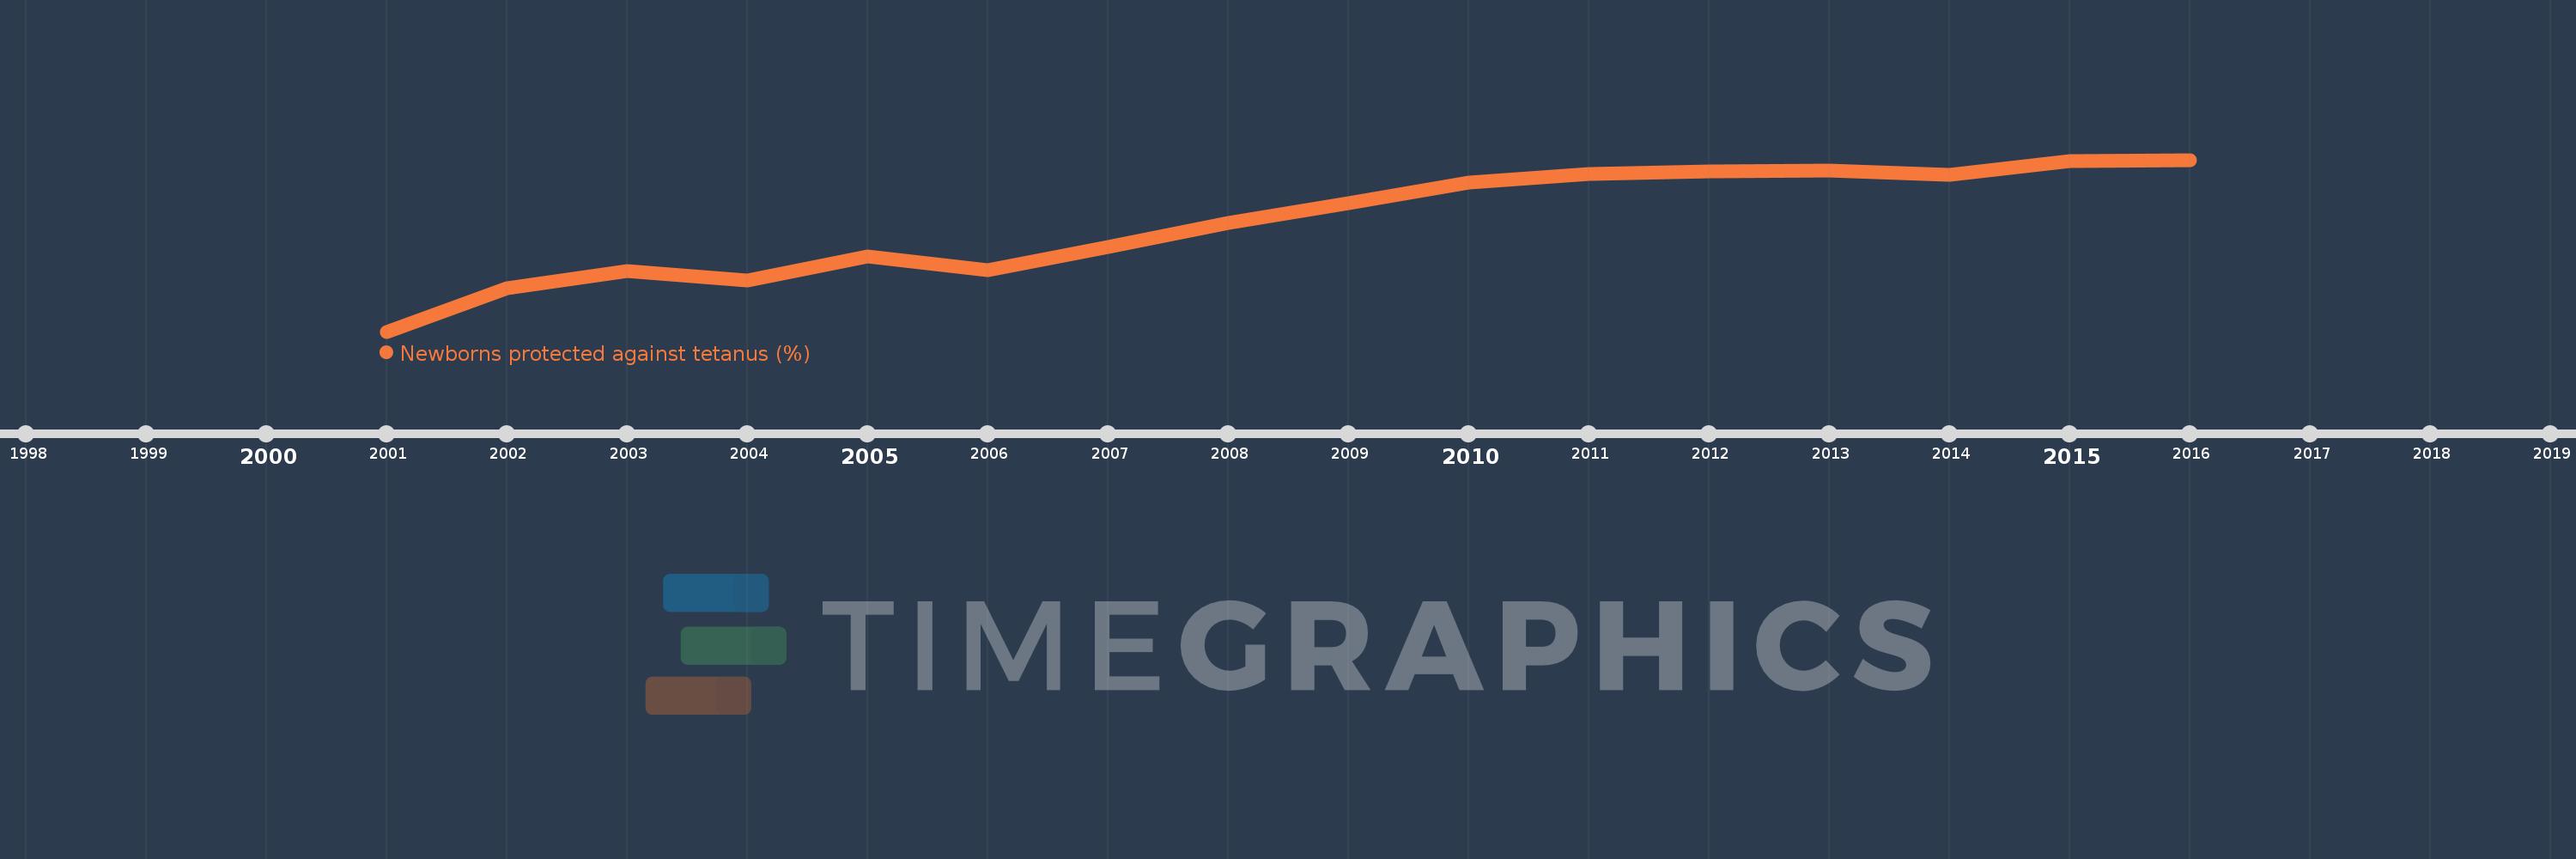
En esta escala de tiempo se presenta un gráfico de 2001 y 2016 de Small states. Los datos de 2000 están ausentes. El número de observaciones reales por fecha: 16.
Fuente (nombre):
Indicadores del desarrollo mundial
Fuente (organización):
WHO and UNICEF (http://www.who.int/immunization/monitoring_surveillance/en/).
Categorías:
Health
Se ha actualizado:
23 abr 2017 año
Los indicadores de los cambios de valor en los últimos años
En promedio:
80.223
Mínimo:
69.696
1 ene 2001 año
Máximo:
86.328
1 ene 2016 año
A la fecha de observación
Valor
Cambio absoluto
El cambio con respecto al valor anterior
1 ene 2001 año
69.696
+69.696
0.0%
1 ene 2002 año
73.921
+4.225
6.06%
1 ene 2003 año
75.581
+1.66
2.25%
1 ene 2004 año
74.644
-0.937
-1.24%
1 ene 2005 año
76.999
+2.355
3.16%
1 ene 2006 año
75.612
-1.387
-1.8%
1 ene 2007 año
77.886
+2.274
3.01%
1 ene 2008 año
80.234
+2.347
3.01%
1 ene 2009 año
82.1
+1.867
2.33%
1 ene 2010 año
84.088
+1.987
2.42%
1 ene 2011 año
84.992
+0.904
1.07%
1 ene 2012 año
85.185
+0.193
0.23%
1 ene 2013 año
85.288
+0.103
0.12%
1 ene 2014 año
84.844
-0.444
-0.52%
1 ene 2015 año
86.163
+1.319
1.55%
1 ene 2016 año
86.328
+0.165
0.19%
Ranking de los países por los datos estadísticos actuales

Comentarios:

Enviar
PremiumAbout & FeedbackAcuerdoPrivacidad
logo
© 2022 Selected Technologies LLC – Morgan Hill, California