33
/es/
AIzaSyAYiBZKx7MnpbEhh9jyipgxe19OcubqV5w
August 1, 2025
132380
Fiji
FJI
true
2
1
Newborns protected against tetanus (%)
2016,2015,2014,2013,2012,2011,2010,2009,2008,2007,2006,2005,2004,2003,2002,2001,2000,1999,1998,1997,1996,1995,1994,1993,1992,1991
Download
Estadísticas Globales de la Biblioteca →Fiji →

Newborns protected against tetanus (%)

Estas estadísticas en otros países:

AfghanistanAlbaniaAlgeriaAngolaArab WorldBahamas, TheBahrainBangladeshBelizeBeninBhutanBoliviaBotswanaBrazilBrunei DarussalamBurkina FasoBurundiCabo VerdeCambodiaCameroonCaribbean small statesCentral African RepublicChadColombiaComorosCongo, Dem. Rep.Congo, Rep.Cote d'IvoireDjiboutiDominican RepublicEarly-demographic dividendEcuadorEgypt, Arab Rep.El SalvadorEquatorial GuineaEritreaEthiopiaFijiFragile and conflict affected situationsGabonGambia, TheGhanaGuatemalaGuineaGuinea-BissauGuyanaHaitiHeavily indebted poor countries (HIPC)HondurasIDA & IBRD totalIDA blendIDA onlyIDA totalIndiaIndonesiaIran, Islamic Rep.IraqJamaicaJordanKenyaKiribatiKorea, Dem. People’s Rep.KuwaitLao PDRLatin America & Caribbean Latin America & Caribbean (excluding high income)Latin America & the Caribbean (IDA & IBRD countries)Least developed countries: UN classificationLesothoLiberiaLow & middle incomeLow incomeLower middle incomeMadagascarMalawiMalaysiaMaldivesMaliMauritaniaMauritiusMexicoMiddle East & North AfricaMiddle East & North Africa (excluding high income)Middle East & North Africa (IDA & IBRD countries)Middle incomeMoroccoMozambiqueMyanmarNamibiaNepalNicaraguaNigerNigeriaOmanOther small statesPacific island small statesPakistanPapua New GuineaParaguayPeruPhilippinesPre-demographic dividendRwandaSao Tome and PrincipeSenegalSeychellesSierra LeoneSmall statesSolomon IslandsSomaliaSouth AfricaSouth AsiaSouth Asia (IDA & IBRD)South SudanSri LankaSub-Saharan Africa Sub-Saharan Africa (excluding high income)Sub-Saharan Africa (IDA & IBRD countries)SudanSurinameSwazilandSyrian Arab RepublicTanzaniaThailandTimor-LesteTogoTunisiaTurkeyUgandaVanuatuVenezuela, RBVietnamYemen, Rep.ZambiaZimbabwe

línea de tiempo (timeline):

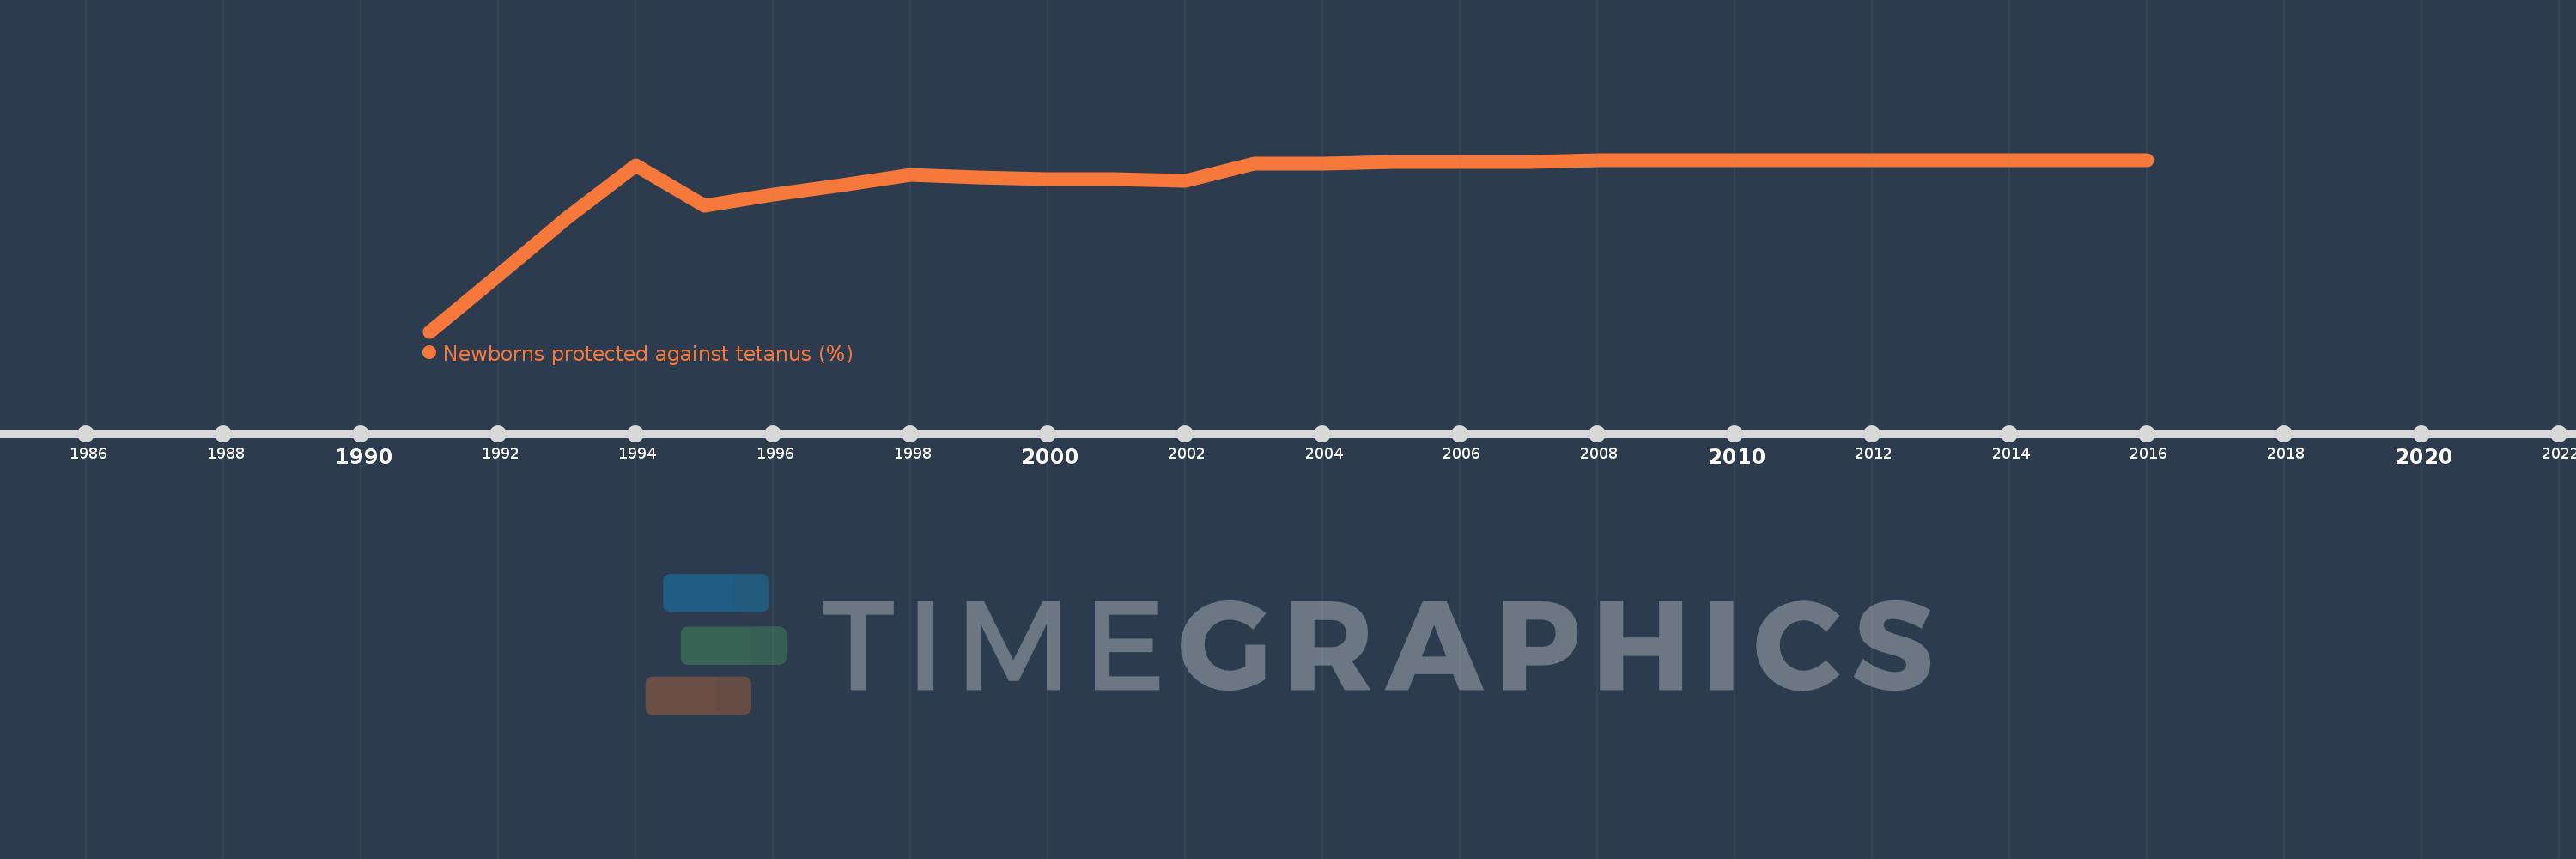
En esta escala de tiempo se presenta un gráfico de 1991 y 2016 de Fiji. Los datos de 1990 están ausentes. El número de observaciones reales por fecha: 26.

Fuente (nombre):

Indicadores del desarrollo mundial

Fuente (organización):

WHO and UNICEF (http://www.who.int/immunization/monitoring_surveillance/en/).

Categorías:

Health

Se ha actualizado:

23 abr 2017 año

Los indicadores de los cambios de valor en los últimos años

En promedio:
82.769
Mínimo:
5.0
1 ene 1991 año
Máximo:
94.0
1 ene 2008 año
A la fecha de observación
Valor
Cambio absoluto
El cambio con respecto al valor anterior
1 ene 1991 año
5.0
+5.0
0.0%
1 ene 1992 año
34.0
+29.0
580.0%
1 ene 1993 año
64.0
+30.0
88.24%
1 ene 1994 año
91.0
+27.0
42.19%
1 ene 1995 año
70.0
-21.0
-23.08%
1 ene 1996 año
76.0
+6.0
8.57%
1 ene 1997 año
81.0
+5.0
6.58%
1 ene 1998 año
86.0
+5.0
6.17%
1 ene 1999 año
85.0
-1.0
-1.16%
1 ene 2000 año
84.0
-1.0
-1.18%
1 ene 2001 año
84.0
0.0
0.0%
1 ene 2002 año
83.0
-1.0
-1.19%
1 ene 2003 año
92.0
+9.0
10.84%
1 ene 2004 año
92.0
0.0
0.0%
1 ene 2005 año
93.0
+1.0
1.09%
1 ene 2006 año
93.0
0.0
0.0%
1 ene 2007 año
93.0
0.0
0.0%
1 ene 2008 año
94.0
+1.0
1.08%
1 ene 2009 año
94.0
0.0
0.0%
1 ene 2010 año
94.0
0.0
0.0%
1 ene 2011 año
94.0
0.0
0.0%
1 ene 2012 año
94.0
0.0
0.0%
1 ene 2013 año
94.0
0.0
0.0%
1 ene 2014 año
94.0
0.0
0.0%
1 ene 2015 año
94.0
0.0
0.0%
1 ene 2016 año
94.0
0.0
0.0%

Ranking de los países por los datos estadísticos actuales