33
/es/
AIzaSyAYiBZKx7MnpbEhh9jyipgxe19OcubqV5w
August 1, 2025
46886
Lower middle income
LMC
false
2
1
Bank liquid reserves to bank assets ratio (%)
2016,2015,2014,2013,2012,2011,2010,2009,2008,2007,2006,2005,2004,2003,2002
Download
Estadísticas Globales de la Biblioteca →Lower middle income →

Bank liquid reserves to bank assets ratio (%)

Estas estadísticas en otros países:

AfghanistanAlbaniaAlgeriaAngolaAntigua and BarbudaArab WorldArmeniaAustraliaAzerbaijanBangladeshBarbadosBelarusBelizeBeninBhutanBoliviaBosnia and HerzegovinaBotswanaBrazilBrunei DarussalamBulgariaBurkina FasoBurundiCabo VerdeCambodiaCameroonCanadaCaribbean small statesCentral African RepublicCentral Europe and the BalticsChadChileColombiaComorosCongo, Dem. Rep.Congo, Rep.Costa RicaCote d'IvoireCroatiaCzech RepublicDenmarkDominicaDominican RepublicEarly-demographic dividendEast Asia & Pacific (excluding high income)East Asia & Pacific (IDA & IBRD countries)Egypt, Arab Rep.Equatorial GuineaEritreaEurope & Central Asia (excluding high income)Europe & Central Asia (IDA & IBRD countries)FijiFragile and conflict affected situationsGabonGambia, TheGeorgiaGhanaGrenadaGuatemalaGuinea-BissauGuyanaHaitiHeavily indebted poor countries (HIPC)HondurasHungaryIBRD onlyIcelandIDA & IBRD totalIDA blendIDA onlyIDA totalIndonesiaIraqIsraelJamaicaJapanKazakhstanKenyaKorea, Rep.KosovoKuwaitKyrgyz RepublicLate-demographic dividendLatin America & Caribbean Latin America & Caribbean (excluding high income)Latin America & the Caribbean (IDA & IBRD countries)Least developed countries: UN classificationLesothoLow & middle incomeLow incomeLower middle incomeMacao SAR, ChinaMacedonia, FYRMalaysiaMaldivesMaliMauritiusMexicoMiddle incomeMoldovaMongoliaMoroccoMozambiqueMyanmarNamibiaNepalNicaraguaNigerNigeriaNorwayOmanOther small statesPakistanPanamaPapua New GuineaParaguayPhilippinesPolandPre-demographic dividendQatarRomaniaRussian FederationRwandaSamoaSao Tome and PrincipeSenegalSerbiaSeychellesSierra LeoneSmall statesSolomon IslandsSouth AfricaSouth AsiaSouth Asia (IDA & IBRD)South SudanSri LankaSt. Kitts and NevisSt. LuciaSt. Vincent and the GrenadinesSub-Saharan Africa Sub-Saharan Africa (excluding high income)Sub-Saharan Africa (IDA & IBRD countries)SudanSurinameSwazilandSwedenSyrian Arab RepublicTajikistanTanzaniaThailandTogoTongaTrinidad and TobagoTurkeyUgandaUkraineUnited Arab EmiratesUpper middle incomeUruguayVanuatuVenezuela, RBWorldZambia

línea de tiempo (timeline):

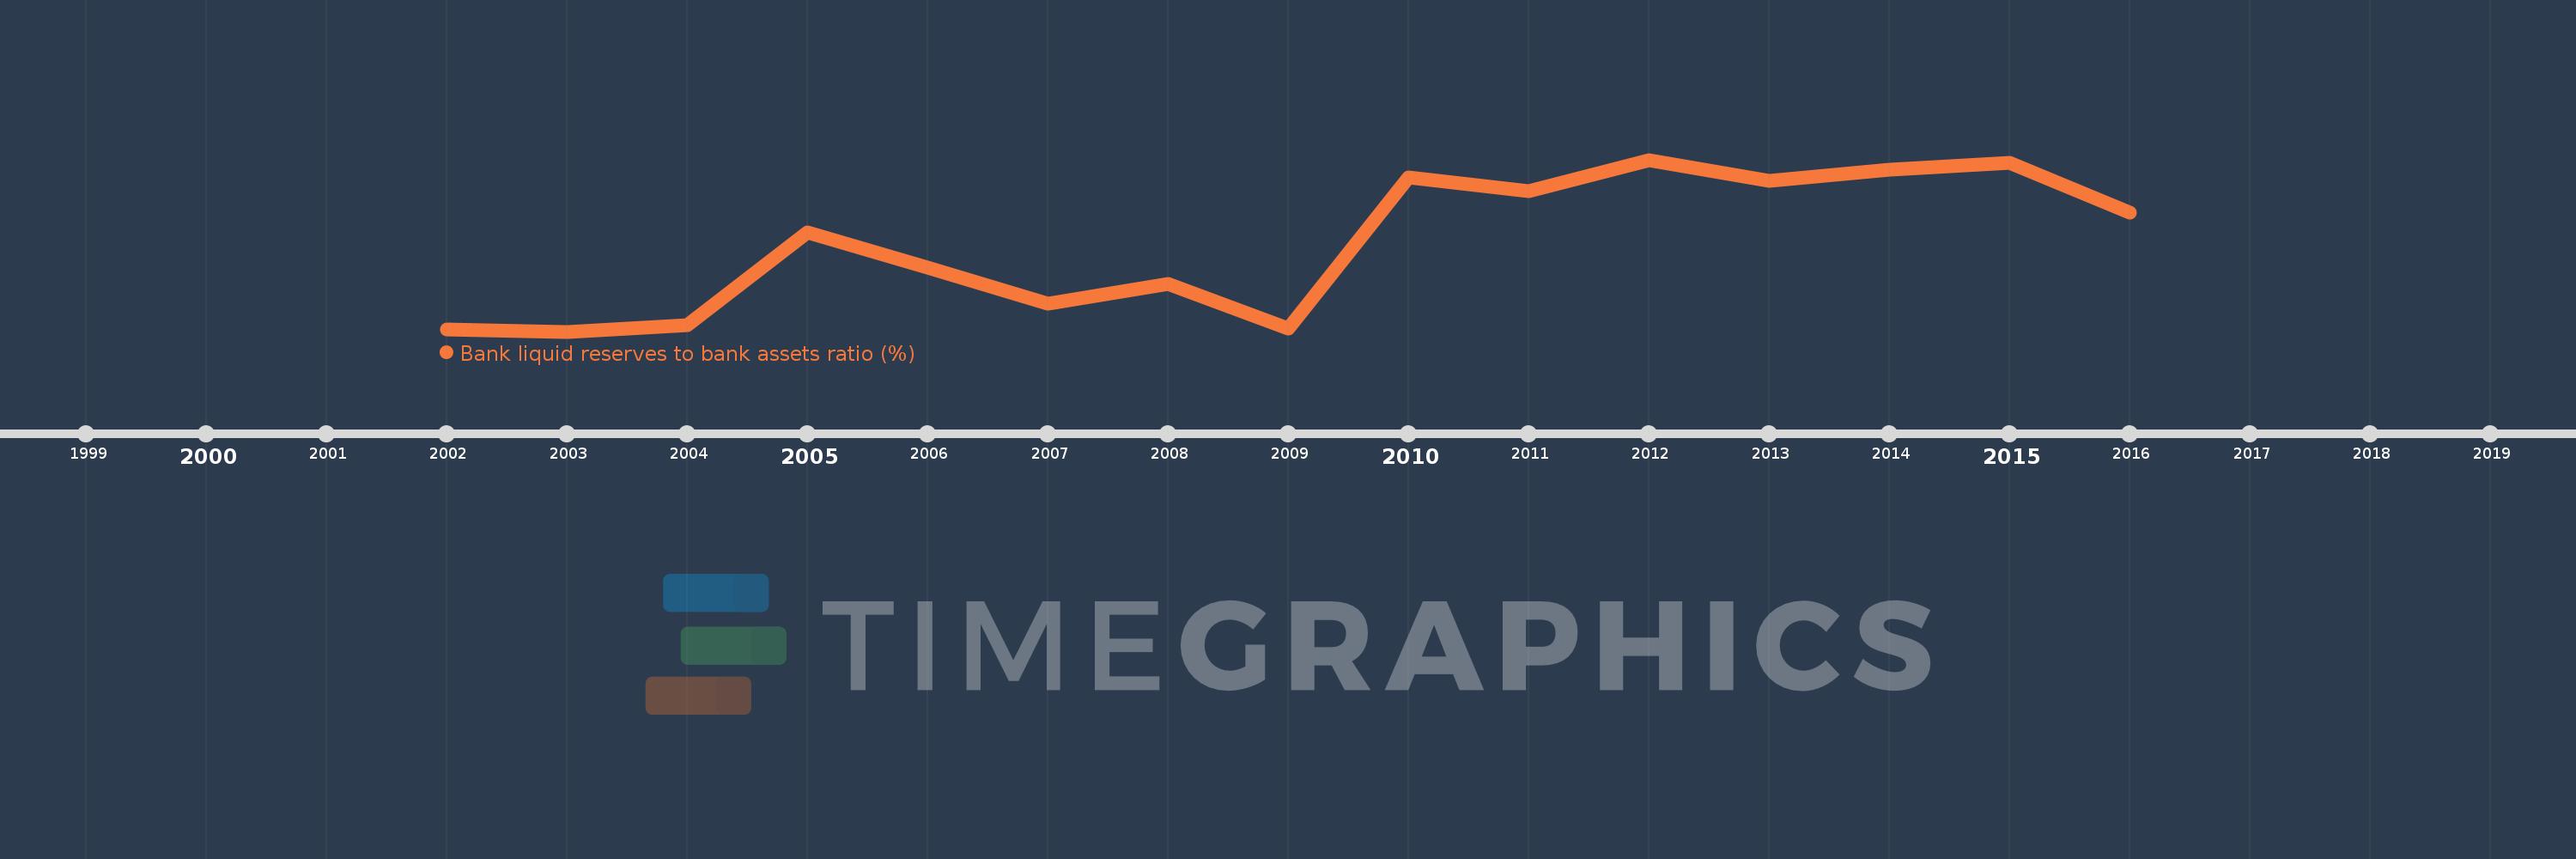
En esta escala de tiempo se presenta un gráfico de 2002 y 2016 de Lower middle income. Los datos de 2001 están ausentes. El número de observaciones reales por fecha: 15.

Fuente (nombre):

Indicadores del desarrollo mundial

Fuente (organización):

International Monetary Fund, International Financial Statistics and data files.

Categorías:

Financial Sector

Se ha actualizado:

23 abr 2017 año

Los indicadores de los cambios de valor en los últimos años

En promedio:
21.365
Mínimo:
17.091
1 ene 2003 año
Máximo:
25.459
1 ene 2012 año
A la fecha de observación
Valor
Cambio absoluto
El cambio con respecto al valor anterior
1 ene 2002 año
17.182
+17.182
0.0%
1 ene 2003 año
17.091
-0.091
-0.53%
1 ene 2004 año
17.387
+0.296
1.73%
1 ene 2005 año
21.907
+4.521
26.0%
1 ene 2006 año
20.19
-1.718
-7.84%
1 ene 2007 año
18.461
-1.729
-8.56%
1 ene 2008 año
19.404
+0.944
5.11%
1 ene 2009 año
17.218
-2.186
-11.27%
1 ene 2010 año
24.598
+7.379
42.86%
1 ene 2011 año
23.933
-0.665
-2.7%
1 ene 2012 año
25.459
+1.526
6.38%
1 ene 2013 año
24.432
-1.027
-4.03%
1 ene 2014 año
24.982
+0.55
2.25%
1 ene 2015 año
25.322
+0.34
1.36%
1 ene 2016 año
22.904
-2.419
-9.55%

Ranking de los países por los datos estadísticos actuales