33
/es/
AIzaSyAYiBZKx7MnpbEhh9jyipgxe19OcubqV5w
August 1, 2025
38771
IDA only
IDX
false
2
1
Bank liquid reserves to bank assets ratio (%)
2016,2015,2014,2013,2012,2011,2010,2009,2008,2007,2006,2005,2004,2003,2002
Download
Estadísticas Globales de la Biblioteca →IDA only →

Bank liquid reserves to bank assets ratio (%)

Estas estadísticas en otros países:

AfghanistanAlbaniaAlgeriaAngolaAntigua and BarbudaArab WorldArmeniaAustraliaAzerbaijanBangladeshBarbadosBelarusBelizeBeninBhutanBoliviaBosnia and HerzegovinaBotswanaBrazilBrunei DarussalamBulgariaBurkina FasoBurundiCabo VerdeCambodiaCameroonCanadaCaribbean small statesCentral African RepublicCentral Europe and the BalticsChadChileColombiaComorosCongo, Dem. Rep.Congo, Rep.Costa RicaCote d'IvoireCroatiaCzech RepublicDenmarkDominicaDominican RepublicEarly-demographic dividendEast Asia & Pacific (excluding high income)East Asia & Pacific (IDA & IBRD countries)Egypt, Arab Rep.Equatorial GuineaEritreaEurope & Central Asia (excluding high income)Europe & Central Asia (IDA & IBRD countries)FijiFragile and conflict affected situationsGabonGambia, TheGeorgiaGhanaGrenadaGuatemalaGuinea-BissauGuyanaHaitiHeavily indebted poor countries (HIPC)HondurasHungaryIBRD onlyIcelandIDA & IBRD totalIDA blendIDA onlyIDA totalIndonesiaIraqIsraelJamaicaJapanKazakhstanKenyaKorea, Rep.KosovoKuwaitKyrgyz RepublicLate-demographic dividendLatin America & Caribbean Latin America & Caribbean (excluding high income)Latin America & the Caribbean (IDA & IBRD countries)Least developed countries: UN classificationLesothoLow & middle incomeLow incomeLower middle incomeMacao SAR, ChinaMacedonia, FYRMalaysiaMaldivesMaliMauritiusMexicoMiddle incomeMoldovaMongoliaMoroccoMozambiqueMyanmarNamibiaNepalNicaraguaNigerNigeriaNorwayOmanOther small statesPakistanPanamaPapua New GuineaParaguayPhilippinesPolandPre-demographic dividendQatarRomaniaRussian FederationRwandaSamoaSao Tome and PrincipeSenegalSerbiaSeychellesSierra LeoneSmall statesSolomon IslandsSouth AfricaSouth AsiaSouth Asia (IDA & IBRD)South SudanSri LankaSt. Kitts and NevisSt. LuciaSt. Vincent and the GrenadinesSub-Saharan Africa Sub-Saharan Africa (excluding high income)Sub-Saharan Africa (IDA & IBRD countries)SudanSurinameSwazilandSwedenSyrian Arab RepublicTajikistanTanzaniaThailandTogoTongaTrinidad and TobagoTurkeyUgandaUkraineUnited Arab EmiratesUpper middle incomeUruguayVanuatuVenezuela, RBWorldZambia

línea de tiempo (timeline):

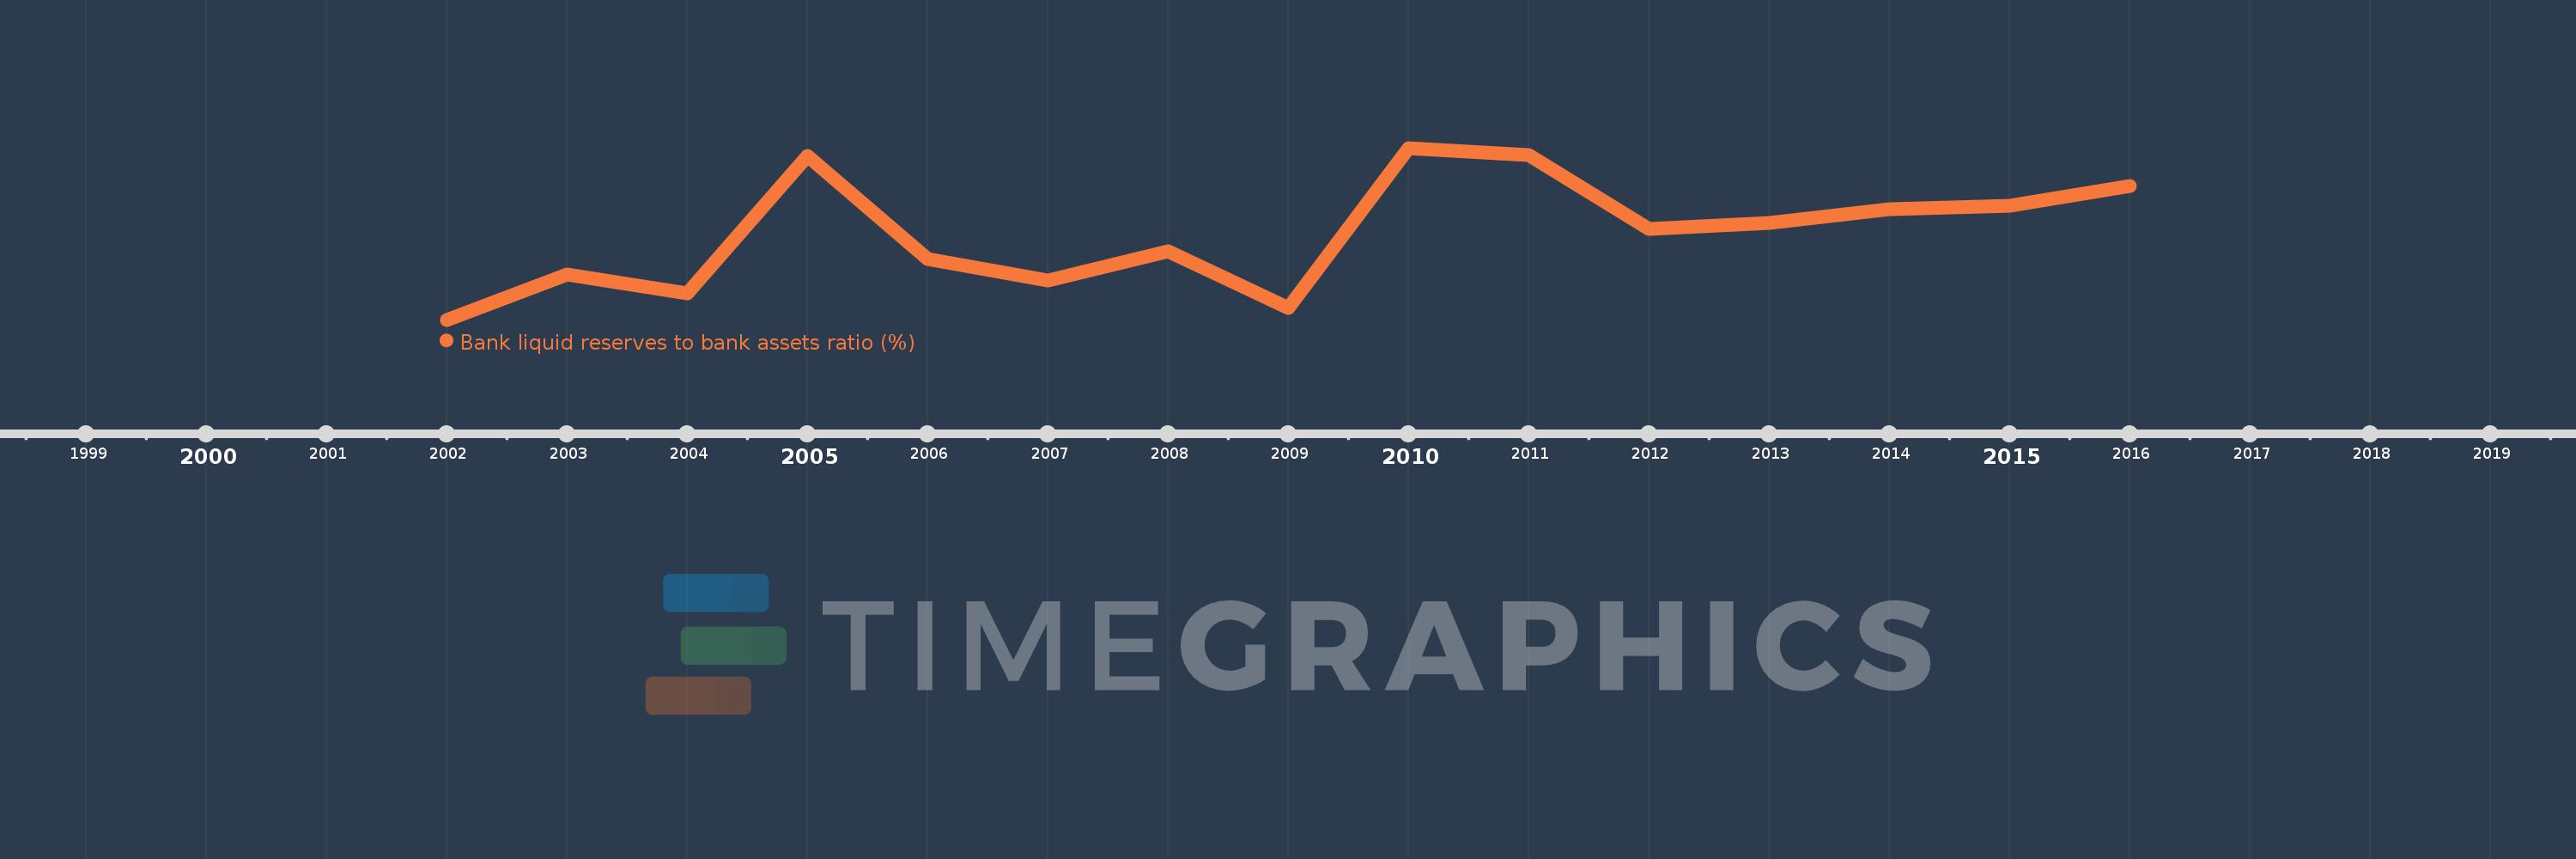
En esta escala de tiempo se presenta un gráfico de 2002 y 2016 de IDA only. Los datos de 2001 están ausentes. El número de observaciones reales por fecha: 15.

Fuente (nombre):

Indicadores del desarrollo mundial

Fuente (organización):

International Monetary Fund, International Financial Statistics and data files.

Categorías:

Financial Sector

Se ha actualizado:

23 abr 2017 año

Los indicadores de los cambios de valor en los últimos años

En promedio:
18.985
Mínimo:
16.485
1 ene 2002 año
Máximo:
21.45
1 ene 2010 año
A la fecha de observación
Valor
Cambio absoluto
El cambio con respecto al valor anterior
1 ene 2002 año
16.485
+16.485
0.0%
1 ene 2003 año
17.786
+1.301
7.89%
1 ene 2004 año
17.246
-0.54
-3.04%
1 ene 2005 año
21.227
+3.982
23.09%
1 ene 2006 año
18.248
-2.98
-14.04%
1 ene 2007 año
17.618
-0.63
-3.45%
1 ene 2008 año
18.452
+0.834
4.74%
1 ene 2009 año
16.836
-1.616
-8.76%
1 ene 2010 año
21.45
+4.614
27.41%
1 ene 2011 año
21.243
-0.207
-0.96%
1 ene 2012 año
19.108
-2.135
-10.05%
1 ene 2013 año
19.272
+0.165
0.86%
1 ene 2014 año
19.685
+0.413
2.14%
1 ene 2015 año
19.774
+0.089
0.45%
1 ene 2016 año
20.344
+0.57
2.88%

Ranking de los países por los datos estadísticos actuales