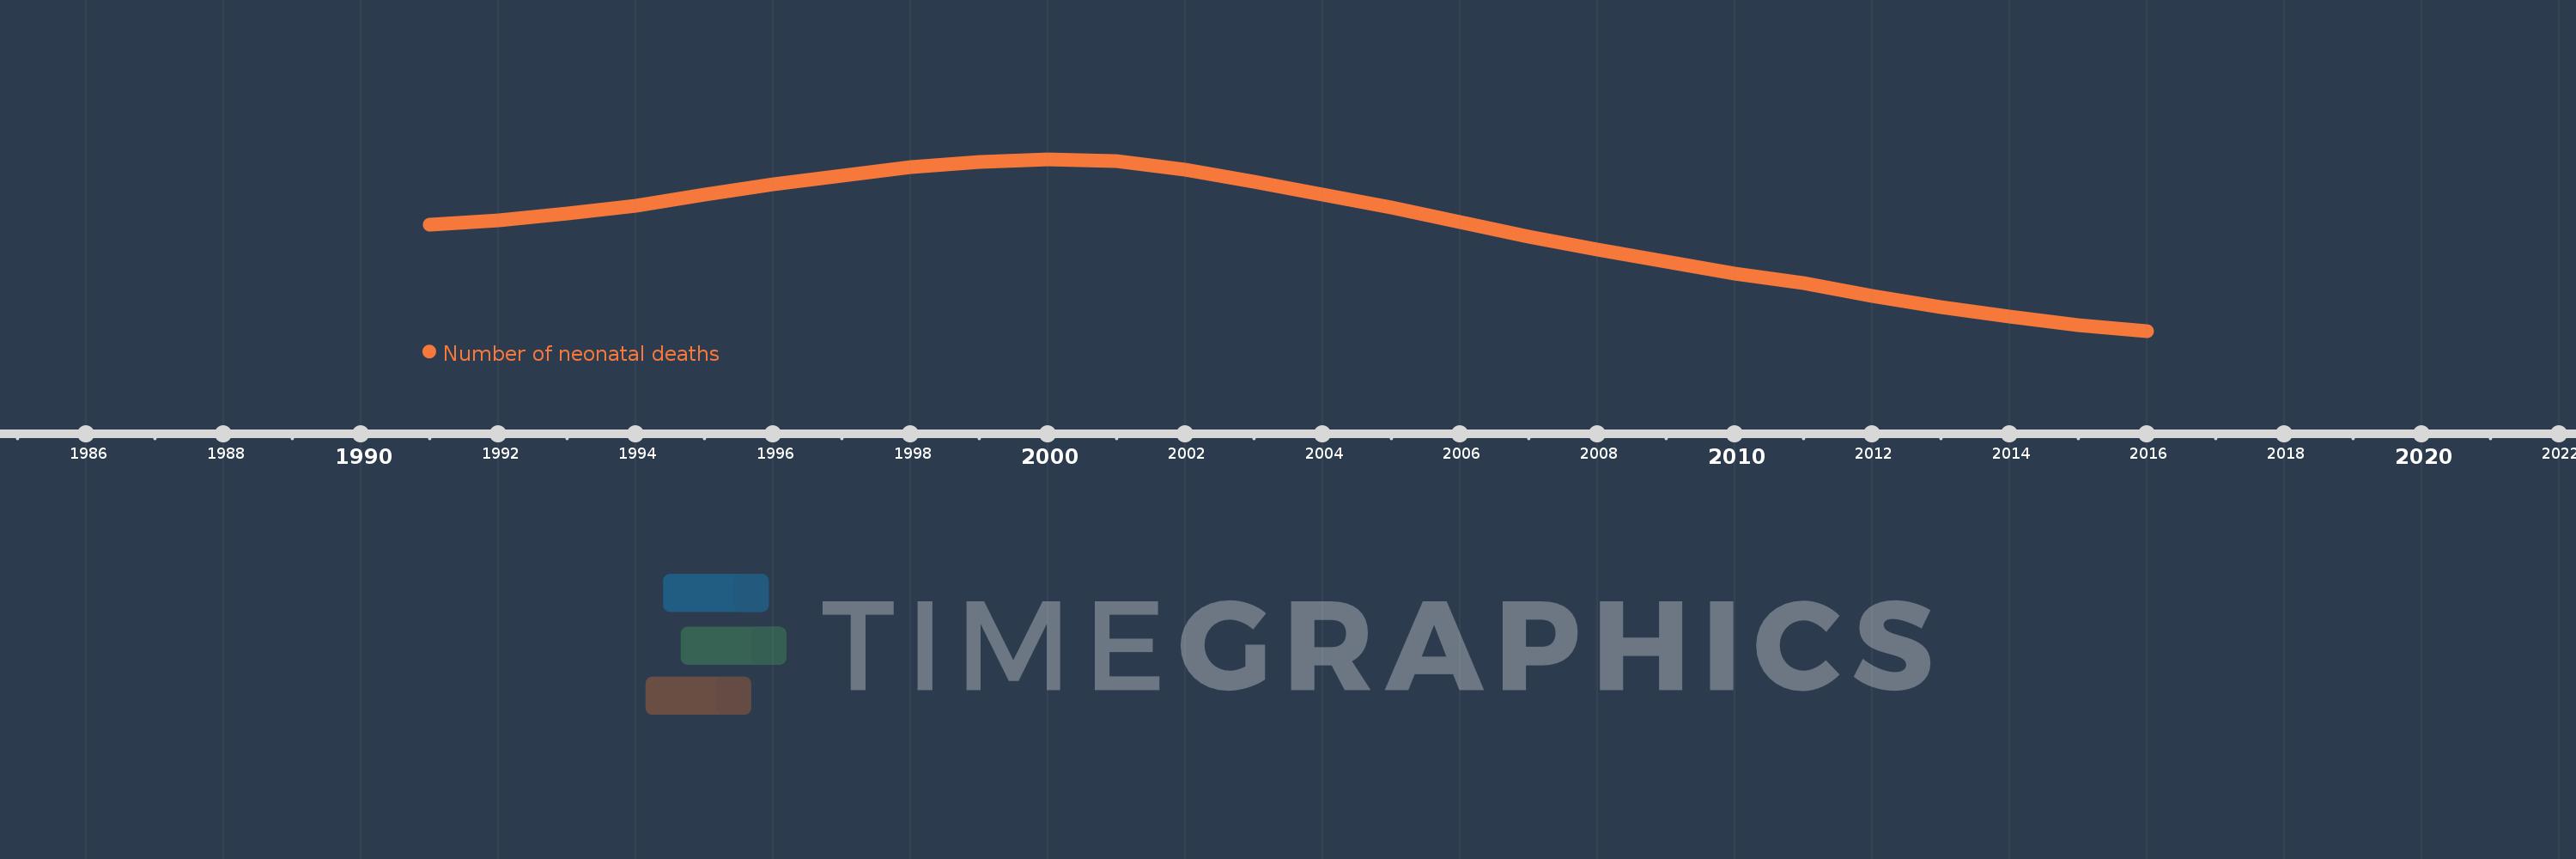
En esta escala de tiempo se presenta un gráfico de 1991 y 2016 de Low income. Los datos de 1990 están ausentes. El número de observaciones reales por fecha: 26.
Fuente (nombre):
Indicadores del desarrollo mundial
Fuente (organización):
Estimates developed by the UN Inter-agency Group for Child Mortality Estimation (UNICEF, WHO, World Bank, UN DESA Population Division) at www.childmortality.org.
Categorías:
Health
Se ha actualizado:
23 abr 2017 año
Los indicadores de los cambios de valor en los últimos años
En promedio:
666.697 mil
Mínimo:
603.221 mil
1 ene 2016 año
Máximo:
709.024 mil
1 ene 2000 año
A la fecha de observación
Valor
Cambio absoluto
El cambio con respecto al valor anterior
1 ene 1991 año
668.479 mil
+668.479 mil
0.0%
1 ene 1992 año
671.105 mil
+2.626 mil
0.39%
1 ene 1993 año
675.279 mil
+4.174 mil
0.62%
1 ene 1994 año
680.541 mil
+5.262 mil
0.78%
1 ene 1995 año
686.973 mil
+6.432 mil
0.95%
1 ene 1996 año
693.29 mil
+6.317 mil
0.92%
1 ene 1997 año
698.877 mil
+5.587 mil
0.81%
1 ene 1998 año
704.243 mil
+5.366 mil
0.77%
1 ene 1999 año
707.339 mil
+3.096 mil
0.44%
1 ene 2000 año
709.024 mil
+1.685 mil
0.24%
1 ene 2001 año
708.065 mil
-959.0
-0.14%
1 ene 2002 año
702.265 mil
-5.8 mil
-0.82%
1 ene 2003 año
695.1 mil
-7.165 mil
-1.02%
1 ene 2004 año
687.296 mil
-7.804 mil
-1.12%
1 ene 2005 año
679.083 mil
-8.213 mil
-1.19%
1 ene 2006 año
670.345 mil
-8.738 mil
-1.29%
1 ene 2007 año
661.418 mil
-8.927 mil
-1.33%
1 ene 2008 año
653.418 mil
-8.0 mil
-1.21%
1 ene 2009 año
645.821 mil
-7.597 mil
-1.16%
1 ene 2010 año
638.559 mil
-7.262 mil
-1.12%
1 ene 2011 año
632.811 mil
-5.748 mil
-0.9%
1 ene 2012 año
624.791 mil
-8.02 mil
-1.27%
1 ene 2013 año
617.97 mil
-6.821 mil
-1.09%
1 ene 2014 año
611.878 mil
-6.092 mil
-0.99%
1 ene 2015 año
606.932 mil
-4.946 mil
-0.81%
1 ene 2016 año
603.221 mil
-3.711 mil
-0.61%
Ranking de los países por los datos estadísticos actuales