En esta escala de tiempo se presenta un gráfico de 1991 y 2016 de Nepal. Los datos de 1990 están ausentes. El número de observaciones reales por fecha: 26.
Fuente (nombre):
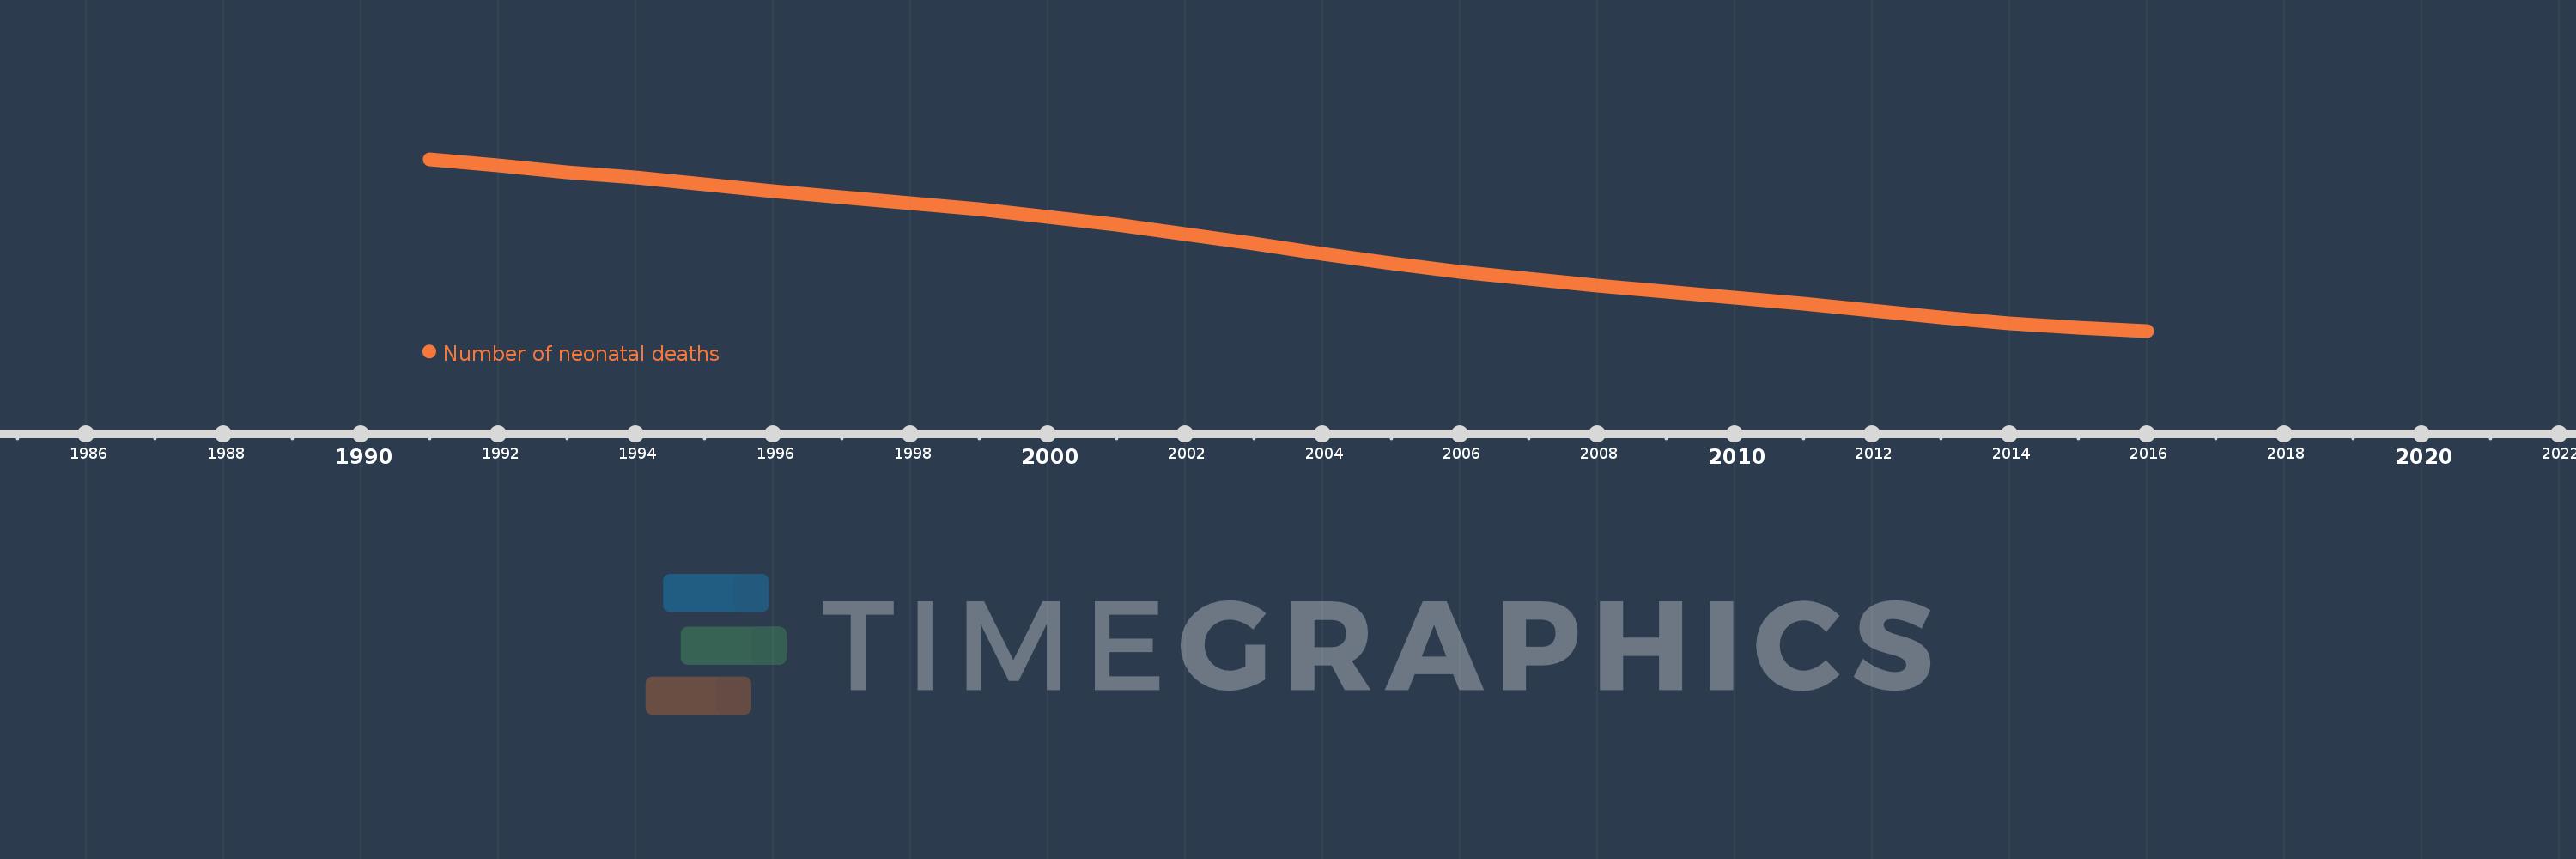
Indicadores del desarrollo mundial
Fuente (organización):
Estimates developed by the UN Inter-agency Group for Child Mortality Estimation (UNICEF, WHO, World Bank, UN DESA Population Division) at www.childmortality.org.
Categorías:
Health
Se ha actualizado:
23 abr 2017 año
Los indicadores de los cambios de valor en los últimos años
En promedio:
26.378 mil
Mínimo:
12.252 mil
1 ene 2016 año
Máximo:
41.341 mil
1 ene 1991 año
A la fecha de observación
Valor
Cambio absoluto
El cambio con respecto al valor anterior
1 ene 1991 año
41.341 mil
+41.341 mil
0.0%
1 ene 1992 año
40.223 mil
-1.118 mil
-2.7%
1 ene 1993 año
39.179 mil
-1.044 mil
-2.6%
1 ene 1994 año
38.173 mil
-1.006 mil
-2.57%
1 ene 1995 año
37.09 mil
-1.083 mil
-2.84%
1 ene 1996 año
35.897 mil
-1.193 mil
-3.22%
1 ene 1997 año
34.889 mil
-1.008 mil
-2.81%
1 ene 1998 año
33.861 mil
-1.028 mil
-2.95%
1 ene 1999 año
32.834 mil
-1.027 mil
-3.03%
1 ene 2000 año
31.588 mil
-1.246 mil
-3.79%
1 ene 2001 año
30.187 mil
-1.401 mil
-4.44%
1 ene 2002 año
28.629 mil
-1.558 mil
-5.16%
1 ene 2003 año
27.051 mil
-1.578 mil
-5.51%
1 ene 2004 año
25.328 mil
-1.723 mil
-6.37%
1 ene 2005 año
23.727 mil
-1.601 mil
-6.32%
1 ene 2006 año
22.249 mil
-1.478 mil
-6.23%
1 ene 2007 año
21.031 mil
-1.218 mil
-5.47%
1 ene 2008 año
19.927 mil
-1.104 mil
-5.25%
1 ene 2009 año
18.952 mil
-975.0
-4.89%
1 ene 2010 año
17.901 mil
-1.051 mil
-5.55%
1 ene 2011 año
16.869 mil
-1.032 mil
-5.77%
1 ene 2012 año
15.679 mil
-1.19 mil
-7.05%
1 ene 2013 año
14.595 mil
-1.084 mil
-6.91%
1 ene 2014 año
13.58 mil
-1.015 mil
-6.95%
1 ene 2015 año
12.8 mil
-780.0
-5.74%
1 ene 2016 año
12.252 mil
-548.0
-4.28%
Ranking de los países por los datos estadísticos actuales