33
/es/
AIzaSyAYiBZKx7MnpbEhh9jyipgxe19OcubqV5w
August 1, 2025
42288
Latin America & Caribbean (excluding high income)
LAC
false
2
1
Employers, total (% of total employment)
2013,2012,2010,2009,2008,2007,2006,2005,2004,2003,2002,2001,1997,1996,1994
Download
Estadísticas Globales de la Biblioteca →Latin America & Caribbean (excluding high income) →

Employers, total (% of total employment)

Estas estadísticas en otros países:

AlbaniaAlgeriaAmerican SamoaAntigua and BarbudaArgentinaArmeniaArubaAustriaAzerbaijanBahrainBangladeshBarbadosBelarusBelgiumBelizeBeninBermudaBhutanBoliviaBotswanaBrazilBritish Virgin IslandsBrunei DarussalamBulgariaBurkina FasoBurundiCabo VerdeCambodiaCameroonCaribbean small statesCayman IslandsCentral Europe and the BalticsChadChileColombiaCongo, Rep.Costa RicaCote d'IvoireCroatiaCyprusCzech RepublicDenmarkDjiboutiDominicaDominican RepublicEarly-demographic dividendEcuadorEgypt, Arab Rep.El SalvadorEstoniaEthiopiaEuro areaEurope & Central AsiaEurope & Central Asia (excluding high income)Europe & Central Asia (IDA & IBRD countries)European UnionFijiFinlandFranceGabonGambia, TheGeorgiaGermanyGhanaGreeceGrenadaGuamGuatemalaGuineaHondurasHong Kong SAR, ChinaHungaryIcelandIndiaIndonesiaIran, Islamic Rep.IrelandIsle of ManItalyJamaicaJordanKazakhstanKiribatiKosovoKuwaitKyrgyz RepublicLao PDRLatin America & Caribbean Latin America & Caribbean (excluding high income)Latin America & the Caribbean (IDA & IBRD countries)LatviaLebanonLesothoLiberiaLithuaniaLower middle incomeLuxembourgMacao SAR, ChinaMacedonia, FYRMadagascarMalawiMalaysiaMaldivesMaliMaltaMarshall IslandsMauritiusMiddle East & North AfricaMiddle East & North Africa (excluding high income)Middle East & North Africa (IDA & IBRD countries)MoldovaMongoliaMoroccoMozambiqueNamibiaNepalNetherlandsNicaraguaNigerNorwayOmanPakistanPanamaParaguayPeruPhilippinesPolandPortugalQatarRomaniaRussian FederationRwandaSamoaSan MarinoSao Tome and PrincipeSaudi ArabiaSenegalSerbiaSeychellesSingaporeSlovak RepublicSloveniaSouth AfricaSouth AsiaSouth Asia (IDA & IBRD)SpainSri LankaSt. Kitts and NevisSt. LuciaSt. Vincent and the GrenadinesSurinameSwazilandSwedenSwitzerlandSyrian Arab RepublicTajikistanTanzaniaThailandTimor-LesteTongaTrinidad and TobagoTunisiaTurkeyTurks and Caicos IslandsTuvaluUgandaUkraineUnited Arab EmiratesUnited KingdomUruguayVanuatuVenezuela, RBVietnamWest Bank and GazaYemen, Rep.ZambiaZimbabwe

línea de tiempo (timeline):

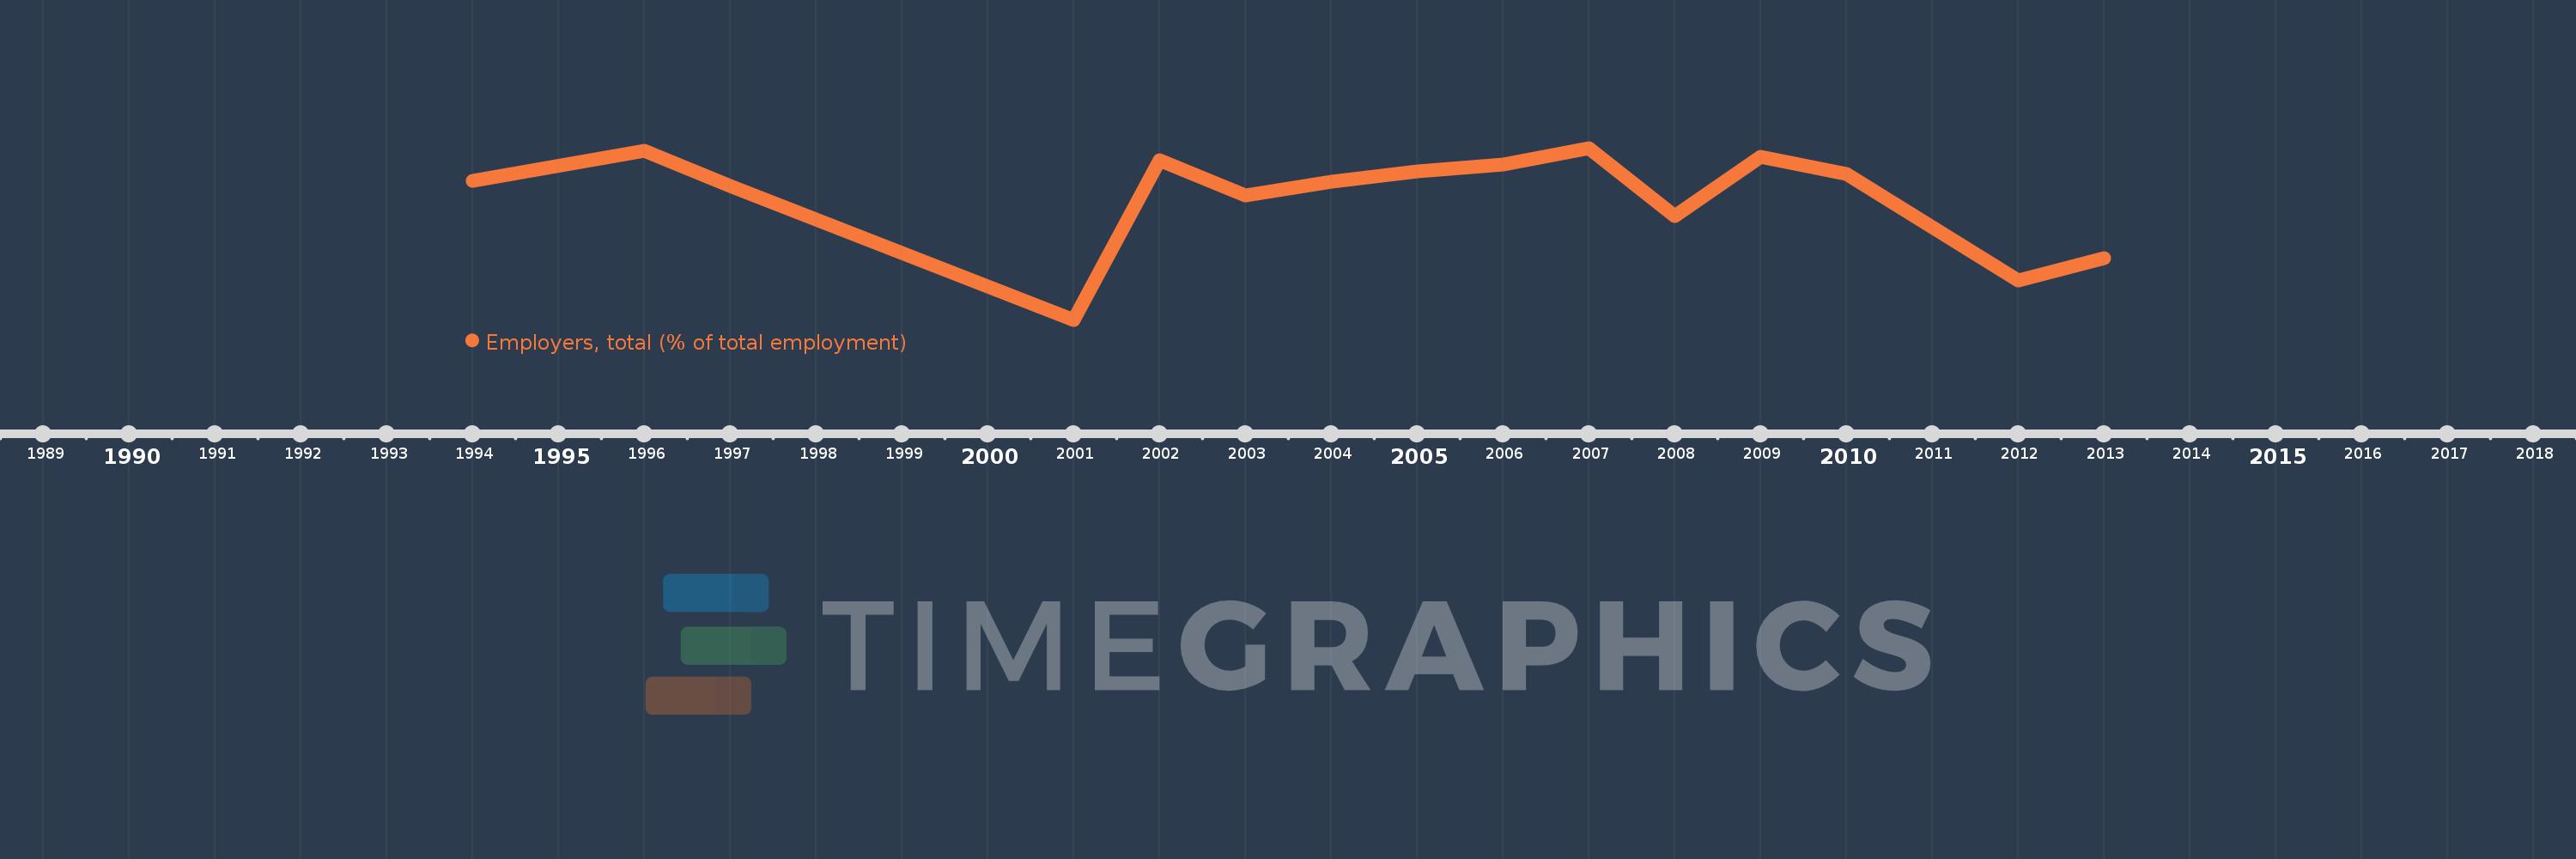
En esta escala de tiempo se presenta un gráfico de 1994 y 2013 de Latin America & Caribbean (excluding high income). Los datos de 1993 están ausentes. El número de observaciones reales por fecha: 15.

Fuente (nombre):

Indicadores del desarrollo mundial

Fuente (organización):

ILO Key Indicators of the Labour Market (KILM).

Categorías:

Social Protection & Labor

Se ha actualizado:

23 abr 2017 año

Los indicadores de los cambios de valor en los últimos años

En promedio:
4.359
Mínimo:
3.632
1 ene 2001 año
Máximo:
4.643
1 ene 2007 año
A la fecha de observación
Valor
Cambio absoluto
El cambio con respecto al valor anterior
1 ene 1994 año
4.45
+4.45
0.0%
1 ene 1996 año
4.625
+0.176
3.95%
1 ene 1997 año
4.42
-0.206
-4.44%
1 ene 2001 año
3.632
-0.788
-17.82%
1 ene 2002 año
4.573
+0.941
25.9%
1 ene 2003 año
4.361
-0.212
-4.64%
1 ene 2004 año
4.443
+0.083
1.9%
1 ene 2005 año
4.504
+0.06
1.36%
1 ene 2006 año
4.547
+0.043
0.96%
1 ene 2007 año
4.643
+0.096
2.12%
1 ene 2008 año
4.244
-0.399
-8.6%
1 ene 2009 año
4.592
+0.349
8.22%
1 ene 2010 año
4.489
-0.103
-2.25%
1 ene 2012 año
3.862
-0.627
-13.98%
1 ene 2013 año
3.996
+0.134
3.47%

Ranking de los países por los datos estadísticos actuales