33
/es/
AIzaSyAYiBZKx7MnpbEhh9jyipgxe19OcubqV5w
August 1, 2025
29776
Euro area
EMU
false
2
1
Employers, total (% of total employment)
2015,2014,2013,2012,2011,2010,2009,2008,2007,2006,2005,2004,2003,2002,2001,2000,1999,1998,1997,1996,1995,1994,1993,1992
Download
Estadísticas Globales de la Biblioteca →Euro area →

Employers, total (% of total employment)

Estas estadísticas en otros países:

AlbaniaAlgeriaAmerican SamoaAntigua and BarbudaArgentinaArmeniaArubaAustriaAzerbaijanBahrainBangladeshBarbadosBelarusBelgiumBelizeBeninBermudaBhutanBoliviaBotswanaBrazilBritish Virgin IslandsBrunei DarussalamBulgariaBurkina FasoBurundiCabo VerdeCambodiaCameroonCaribbean small statesCayman IslandsCentral Europe and the BalticsChadChileColombiaCongo, Rep.Costa RicaCote d'IvoireCroatiaCyprusCzech RepublicDenmarkDjiboutiDominicaDominican RepublicEarly-demographic dividendEcuadorEgypt, Arab Rep.El SalvadorEstoniaEthiopiaEuro areaEurope & Central AsiaEurope & Central Asia (excluding high income)Europe & Central Asia (IDA & IBRD countries)European UnionFijiFinlandFranceGabonGambia, TheGeorgiaGermanyGhanaGreeceGrenadaGuamGuatemalaGuineaHondurasHong Kong SAR, ChinaHungaryIcelandIndiaIndonesiaIran, Islamic Rep.IrelandIsle of ManItalyJamaicaJordanKazakhstanKiribatiKosovoKuwaitKyrgyz RepublicLao PDRLatin America & Caribbean Latin America & Caribbean (excluding high income)Latin America & the Caribbean (IDA & IBRD countries)LatviaLebanonLesothoLiberiaLithuaniaLower middle incomeLuxembourgMacao SAR, ChinaMacedonia, FYRMadagascarMalawiMalaysiaMaldivesMaliMaltaMarshall IslandsMauritiusMiddle East & North AfricaMiddle East & North Africa (excluding high income)Middle East & North Africa (IDA & IBRD countries)MoldovaMongoliaMoroccoMozambiqueNamibiaNepalNetherlandsNicaraguaNigerNorwayOmanPakistanPanamaParaguayPeruPhilippinesPolandPortugalQatarRomaniaRussian FederationRwandaSamoaSan MarinoSao Tome and PrincipeSaudi ArabiaSenegalSerbiaSeychellesSingaporeSlovak RepublicSloveniaSouth AfricaSouth AsiaSouth Asia (IDA & IBRD)SpainSri LankaSt. Kitts and NevisSt. LuciaSt. Vincent and the GrenadinesSurinameSwazilandSwedenSwitzerlandSyrian Arab RepublicTajikistanTanzaniaThailandTimor-LesteTongaTrinidad and TobagoTunisiaTurkeyTurks and Caicos IslandsTuvaluUgandaUkraineUnited Arab EmiratesUnited KingdomUruguayVanuatuVenezuela, RBVietnamWest Bank and GazaYemen, Rep.ZambiaZimbabwe

línea de tiempo (timeline):

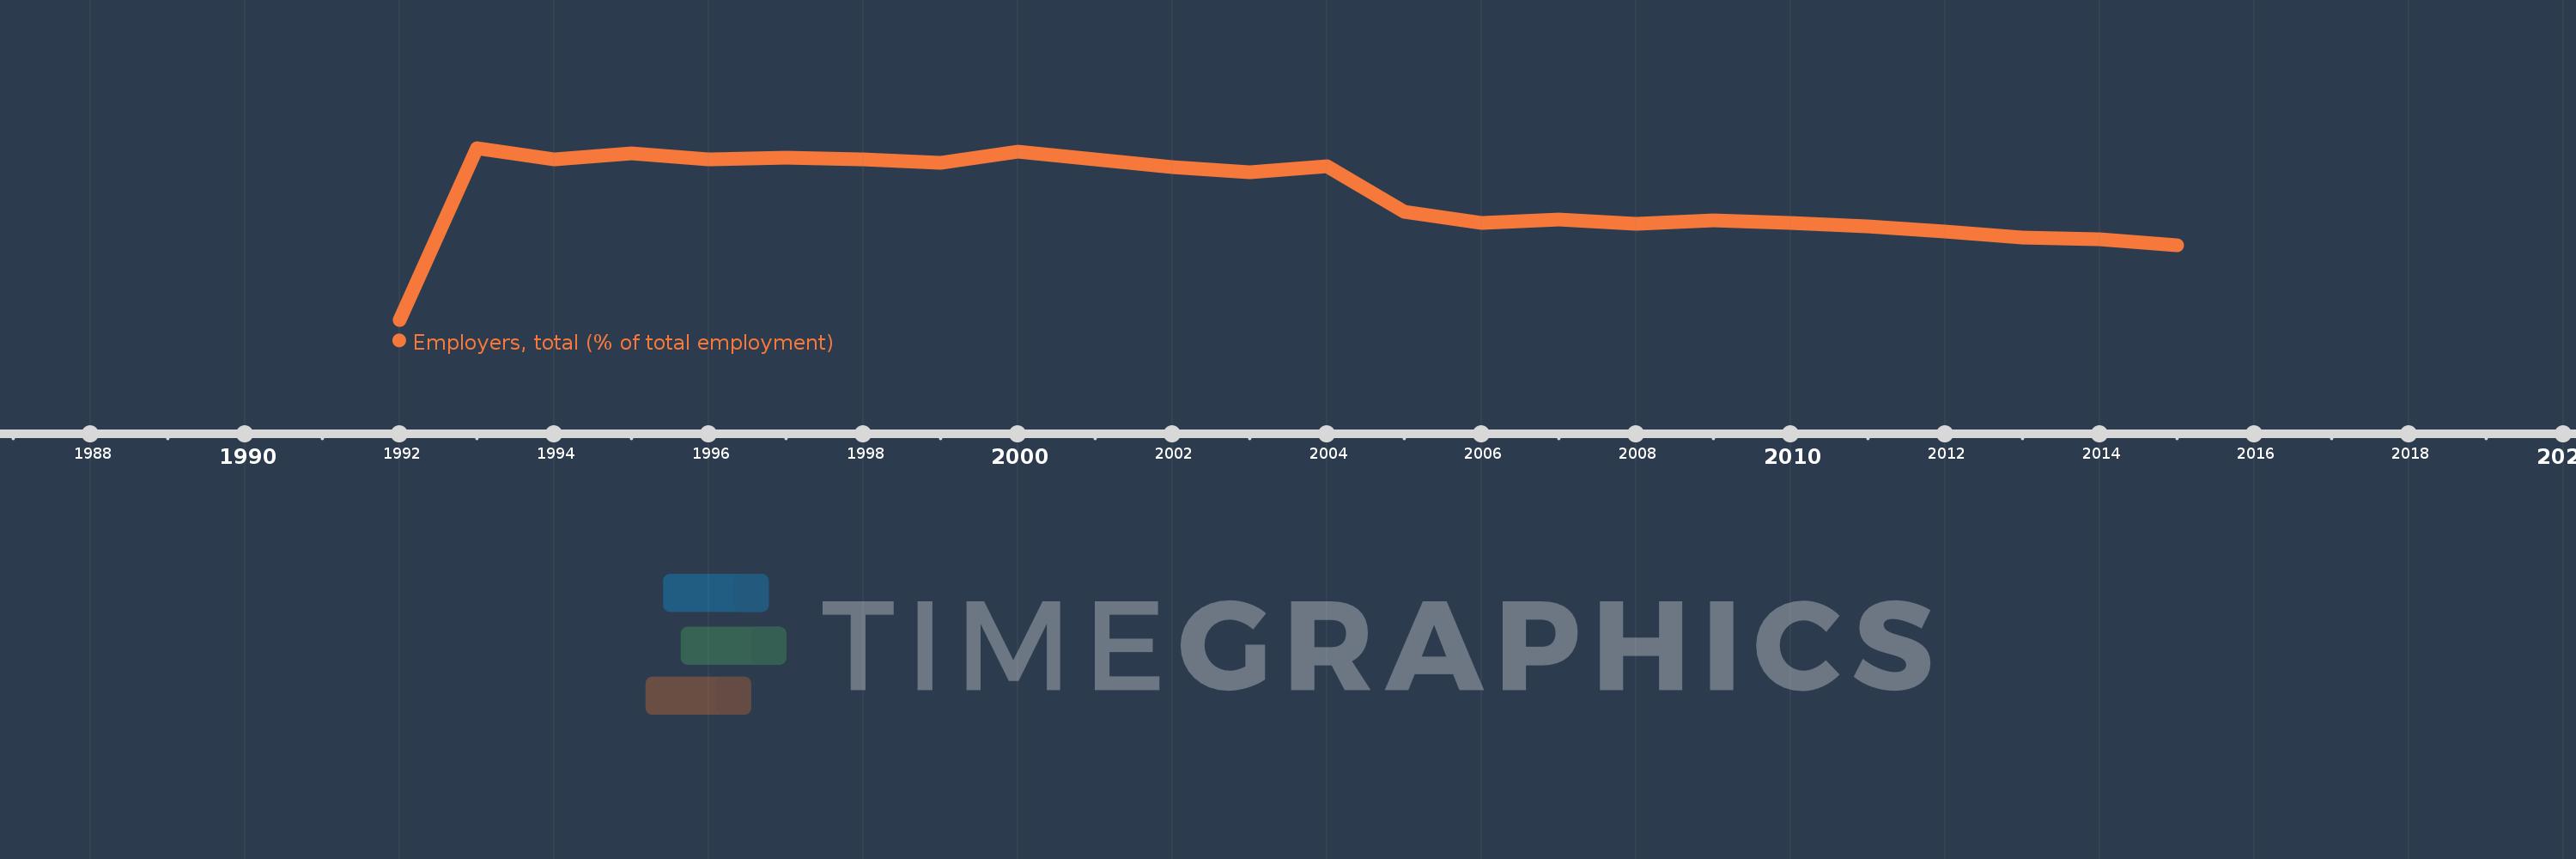
En esta escala de tiempo se presenta un gráfico de 1992 y 2015 de Euro area. Los datos de 1991 están ausentes. El número de observaciones reales por fecha: 24.

Fuente (nombre):

Indicadores del desarrollo mundial

Fuente (organización):

ILO Key Indicators of the Labour Market (KILM).

Categorías:

Social Protection & Labor

Se ha actualizado:

23 abr 2017 año

Los indicadores de los cambios de valor en los últimos años

En promedio:
5.524
Mínimo:
3.757
1 ene 1992 año
Máximo:
6.237
1 ene 1993 año
A la fecha de observación
Valor
Cambio absoluto
El cambio con respecto al valor anterior
1 ene 1992 año
3.757
+3.757
0.0%
1 ene 1993 año
6.237
+2.48
66.01%
1 ene 1994 año
6.076
-0.16
-2.57%
1 ene 1995 año
6.164
+0.088
1.44%
1 ene 1996 año
6.07
-0.094
-1.52%
1 ene 1997 año
6.096
+0.026
0.42%
1 ene 1998 año
6.073
-0.023
-0.38%
1 ene 1999 año
6.025
-0.048
-0.79%
1 ene 2000 año
6.188
+0.163
2.7%
1 ene 2001 año
6.074
-0.113
-1.83%
1 ene 2002 año
5.962
-0.112
-1.85%
1 ene 2003 año
5.887
-0.074
-1.25%
1 ene 2004 año
5.968
+0.08
1.37%
1 ene 2005 año
5.311
-0.657
-11.01%
1 ene 2006 año
5.158
-0.153
-2.87%
1 ene 2007 año
5.2
+0.042
0.81%
1 ene 2008 año
5.143
-0.057
-1.1%
1 ene 2009 año
5.197
+0.054
1.05%
1 ene 2010 año
5.151
-0.046
-0.88%
1 ene 2011 año
5.11
-0.041
-0.8%
1 ene 2012 año
5.025
-0.085
-1.67%
1 ene 2013 año
4.941
-0.083
-1.66%
1 ene 2014 año
4.925
-0.016
-0.33%
1 ene 2015 año
4.833
-0.092
-1.86%

Ranking de los países por los datos estadísticos actuales