33
/es/
AIzaSyAYiBZKx7MnpbEhh9jyipgxe19OcubqV5w
August 1, 2025
33497
European Union
EUU
false
2
1
High-technology exports (current US$)
2016,2015,2014,2013,2012,2011,2010,2009,2008,2007,2006,2005,2004,2003,2002,2001,2000,1999,1998,1997,1996,1995,1994,1993
Download
Estadísticas Globales de la Biblioteca →European Union →

High-technology exports (current US$)

Estas estadísticas en otros países:

AlbaniaAlgeriaAndorraAntigua and BarbudaArab WorldArgentinaArmeniaArubaAustraliaAustriaAzerbaijanBahamas, TheBahrainBangladeshBarbadosBelarusBelgiumBelizeBeninBermudaBhutanBoliviaBosnia and HerzegovinaBotswanaBrazilBrunei DarussalamBulgariaBurkina FasoBurundiCabo VerdeCambodiaCameroonCanadaCaribbean small statesCentral African RepublicCentral Europe and the BalticsChileChinaColombiaComorosCongo, Rep.Costa RicaCote d'IvoireCroatiaCubaCyprusCzech RepublicDenmarkDjiboutiDominicaDominican RepublicEarly-demographic dividendEast Asia & PacificEcuadorEgypt, Arab Rep.El SalvadorEritreaEstoniaEthiopiaEuro areaEurope & Central AsiaEurope & Central Asia (excluding high income)Europe & Central Asia (IDA & IBRD countries)European UnionFaroe IslandsFijiFinlandFranceFrench PolynesiaGabonGambia, TheGeorgiaGermanyGhanaGreeceGreenlandGrenadaGuatemalaGuineaGuinea-BissauGuyanaHaitiHeavily indebted poor countries (HIPC)High incomeHondurasHong Kong SAR, ChinaHungaryIBRD onlyIcelandIDA & IBRD totalIDA blendIDA onlyIDA totalIndiaIndonesiaIran, Islamic Rep.IraqIrelandIsraelItalyJamaicaJapanJordanKazakhstanKenyaKiribatiKorea, Rep.KuwaitKyrgyz RepublicLate-demographic dividendLatin America & Caribbean Latin America & Caribbean (excluding high income)Latin America & the Caribbean (IDA & IBRD countries)LatviaLebanonLesothoLithuaniaLow & middle incomeLow incomeLower middle incomeLuxembourgMacao SAR, ChinaMacedonia, FYRMadagascarMalawiMalaysiaMaldivesMaliMaltaMauritiusMexicoMiddle East & North AfricaMiddle East & North Africa (excluding high income)Middle East & North Africa (IDA & IBRD countries)Middle incomeMoldovaMongoliaMontenegroMoroccoMozambiqueMyanmarNamibiaNepalNetherlandsNew CaledoniaNew ZealandNicaraguaNigerNigeriaNorth AmericaNorwayOECD membersOmanOther small statesPakistanPalauPanamaPapua New GuineaParaguayPeruPhilippinesPolandPortugalPost-demographic dividendQatarRomaniaRussian FederationRwandaSamoaSao Tome and PrincipeSaudi ArabiaSenegalSerbiaSeychellesSierra LeoneSingaporeSlovak RepublicSloveniaSmall statesSolomon IslandsSouth AfricaSouth AsiaSouth Asia (IDA & IBRD)South SudanSpainSri LankaSt. Kitts and NevisSt. LuciaSt. Vincent and the GrenadinesSub-Saharan Africa Sub-Saharan Africa (excluding high income)Sub-Saharan Africa (IDA & IBRD countries)SudanSurinameSwazilandSwedenSwitzerlandSyrian Arab RepublicTajikistanTanzaniaThailandTimor-LesteTogoTongaTrinidad and TobagoTunisiaTurkeyTurkmenistanTurks and Caicos IslandsTuvaluUgandaUkraineUnited Arab EmiratesUnited KingdomUnited StatesUpper middle incomeUruguayVanuatuVenezuela, RBVietnamWest Bank and GazaWorldYemen, Rep.ZambiaZimbabwe

línea de tiempo (timeline):

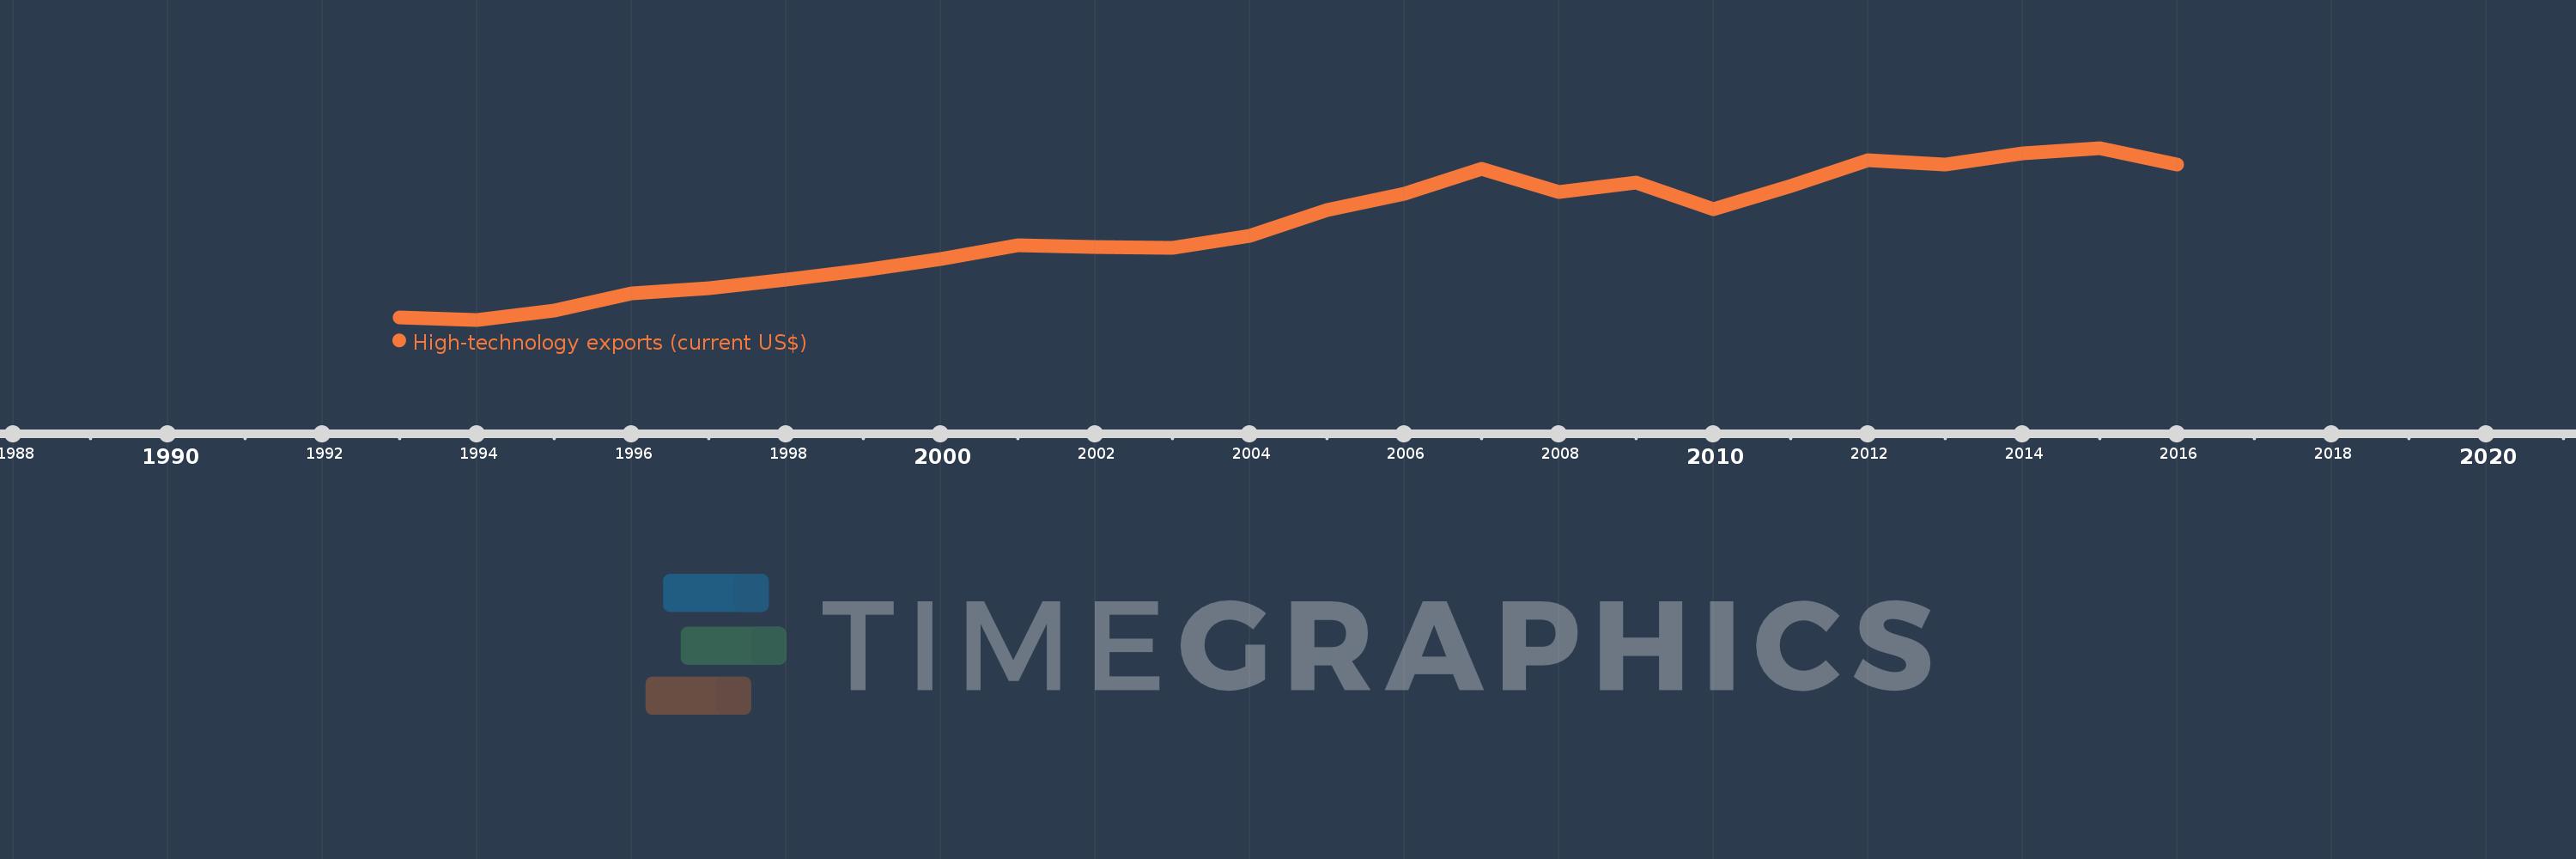
En esta escala de tiempo se presenta un gráfico de 1993 y 2016 de European Union. Los datos de 1992 están ausentes. El número de observaciones reales por fecha: 24.

Fuente (nombre):

Indicadores del desarrollo mundial

Fuente (organización):

United Nations, Comtrade database.

Categorías:

Private Sector, Science & Technology, Trade

Se ha actualizado:

23 abr 2017 año

Los indicadores de los cambios de valor en los últimos años

En promedio:
449.582 bn
Mínimo:
167.071 bn
1 ene 1994 año
Máximo:
690.104 bn
1 ene 2015 año
A la fecha de observación
Valor
Cambio absoluto
El cambio con respecto al valor anterior
1 ene 1993 año
174.07 bn
+174.07 bn
0.0%
1 ene 1994 año
167.071 bn
-6.999 bn
-4.02%
1 ene 1995 año
194.848 bn
+27.777 bn
16.63%
1 ene 1996 año
247.655 bn
+52.807 bn
27.1%
1 ene 1997 año
262.638 bn
+14.983 bn
6.05%
1 ene 1998 año
290.241 bn
+27.603 bn
10.51%
1 ene 1999 año
318.172 bn
+27.931 bn
9.62%
1 ene 2000 año
353.012 bn
+34.84 bn
10.95%
1 ene 2001 año
392.754 bn
+39.743 bn
11.26%
1 ene 2002 año
387.29 bn
-5.465 bn
-1.39%
1 ene 2003 año
386.284 bn
-1.006 bn
-0.26%
1 ene 2004 año
422.591 bn
+36.307 bn
9.4%
1 ene 2005 año
501.705 bn
+79.114 bn
18.72%
1 ene 2006 año
549.419 bn
+47.714 bn
9.51%
1 ene 2007 año
627.452 bn
+78.034 bn
14.2%
1 ene 2008 año
555.933 bn
-71.519 bn
-11.4%
1 ene 2009 año
583.539 bn
+27.606 bn
4.97%
1 ene 2010 año
504.378 bn
-79.161 bn
-13.57%
1 ene 2011 año
574.989 bn
+70.611 bn
14.0%
1 ene 2012 año
652.222 bn
+77.233 bn
13.43%
1 ene 2013 año
640.65 bn
-11.572 bn
-1.77%
1 ene 2014 año
673.584 bn
+32.933 bn
5.14%
1 ene 2015 año
690.104 bn
+16.52 bn
2.45%
1 ene 2016 año
639.365 bn
-50.738 bn
-7.35%

Ranking de los países por los datos estadísticos actuales