29
/es/
es
AIzaSyAYiBZKx7MnpbEhh9jyipgxe19OcubqV5w
April 1, 2024
29925
Euro area
EMU
false
2
1
High-technology exports (current US$)
2016,2015,2014,2013,2012,2011,2010,2009,2008,2007,2006,2005,2004,2003,2002,2001,2000,1999,1998,1997,1996,1995,1994,1993
Download
Estadísticas Globales de la Biblioteca →Euro area →

High-technology exports (current US$)

Estas estadísticas en otros países:
AlbaniaAlgeriaAndorraAntigua and BarbudaArab WorldArgentinaArmeniaArubaAustraliaAustriaAzerbaijanBahamas, TheBahrainBangladeshBarbadosBelarusBelgiumBelizeBeninBermudaBhutanBoliviaBosnia and HerzegovinaBotswanaBrazilBrunei DarussalamBulgariaBurkina FasoBurundiCabo VerdeCambodiaCameroonCanadaCaribbean small statesCentral African RepublicCentral Europe and the BalticsChileChinaColombiaComorosCongo, Rep.Costa RicaCote d'IvoireCroatiaCubaCyprusCzech RepublicDenmarkDjiboutiDominicaDominican RepublicEarly-demographic dividendEast Asia & PacificEcuadorEgypt, Arab Rep.El SalvadorEritreaEstoniaEthiopiaEuro areaEurope & Central AsiaEurope & Central Asia (excluding high income)Europe & Central Asia (IDA & IBRD countries)European UnionFaroe IslandsFijiFinlandFranceFrench PolynesiaGabonGambia, TheGeorgiaGermanyGhanaGreeceGreenlandGrenadaGuatemalaGuineaGuinea-BissauGuyanaHaitiHeavily indebted poor countries (HIPC)High incomeHondurasHong Kong SAR, ChinaHungaryIBRD onlyIcelandIDA & IBRD totalIDA blendIDA onlyIDA totalIndiaIndonesiaIran, Islamic Rep.IraqIrelandIsraelItalyJamaicaJapanJordanKazakhstanKenyaKiribatiKorea, Rep.KuwaitKyrgyz RepublicLate-demographic dividendLatin America & Caribbean Latin America & Caribbean (excluding high income)Latin America & the Caribbean (IDA & IBRD countries)LatviaLebanonLesothoLithuaniaLow & middle incomeLow incomeLower middle incomeLuxembourgMacao SAR, ChinaMacedonia, FYRMadagascarMalawiMalaysiaMaldivesMaliMaltaMauritiusMexicoMiddle East & North AfricaMiddle East & North Africa (excluding high income)Middle East & North Africa (IDA & IBRD countries)Middle incomeMoldovaMongoliaMontenegroMoroccoMozambiqueMyanmarNamibiaNepalNetherlandsNew CaledoniaNew ZealandNicaraguaNigerNigeriaNorth AmericaNorwayOECD membersOmanOther small statesPakistanPalauPanamaPapua New GuineaParaguayPeruPhilippinesPolandPortugalPost-demographic dividendQatarRomaniaRussian FederationRwandaSamoaSao Tome and PrincipeSaudi ArabiaSenegalSerbiaSeychellesSierra LeoneSingaporeSlovak RepublicSloveniaSmall statesSolomon IslandsSouth AfricaSouth AsiaSouth Asia (IDA & IBRD)South SudanSpainSri LankaSt. Kitts and NevisSt. LuciaSt. Vincent and the GrenadinesSub-Saharan Africa Sub-Saharan Africa (excluding high income)Sub-Saharan Africa (IDA & IBRD countries)SudanSurinameSwazilandSwedenSwitzerlandSyrian Arab RepublicTajikistanTanzaniaThailandTimor-LesteTogoTongaTrinidad and TobagoTunisiaTurkeyTurkmenistanTurks and Caicos IslandsTuvaluUgandaUkraineUnited Arab EmiratesUnited KingdomUnited StatesUpper middle incomeUruguayVanuatuVenezuela, RBVietnamWest Bank and GazaWorldYemen, Rep.ZambiaZimbabwe
línea de tiempo (timeline):
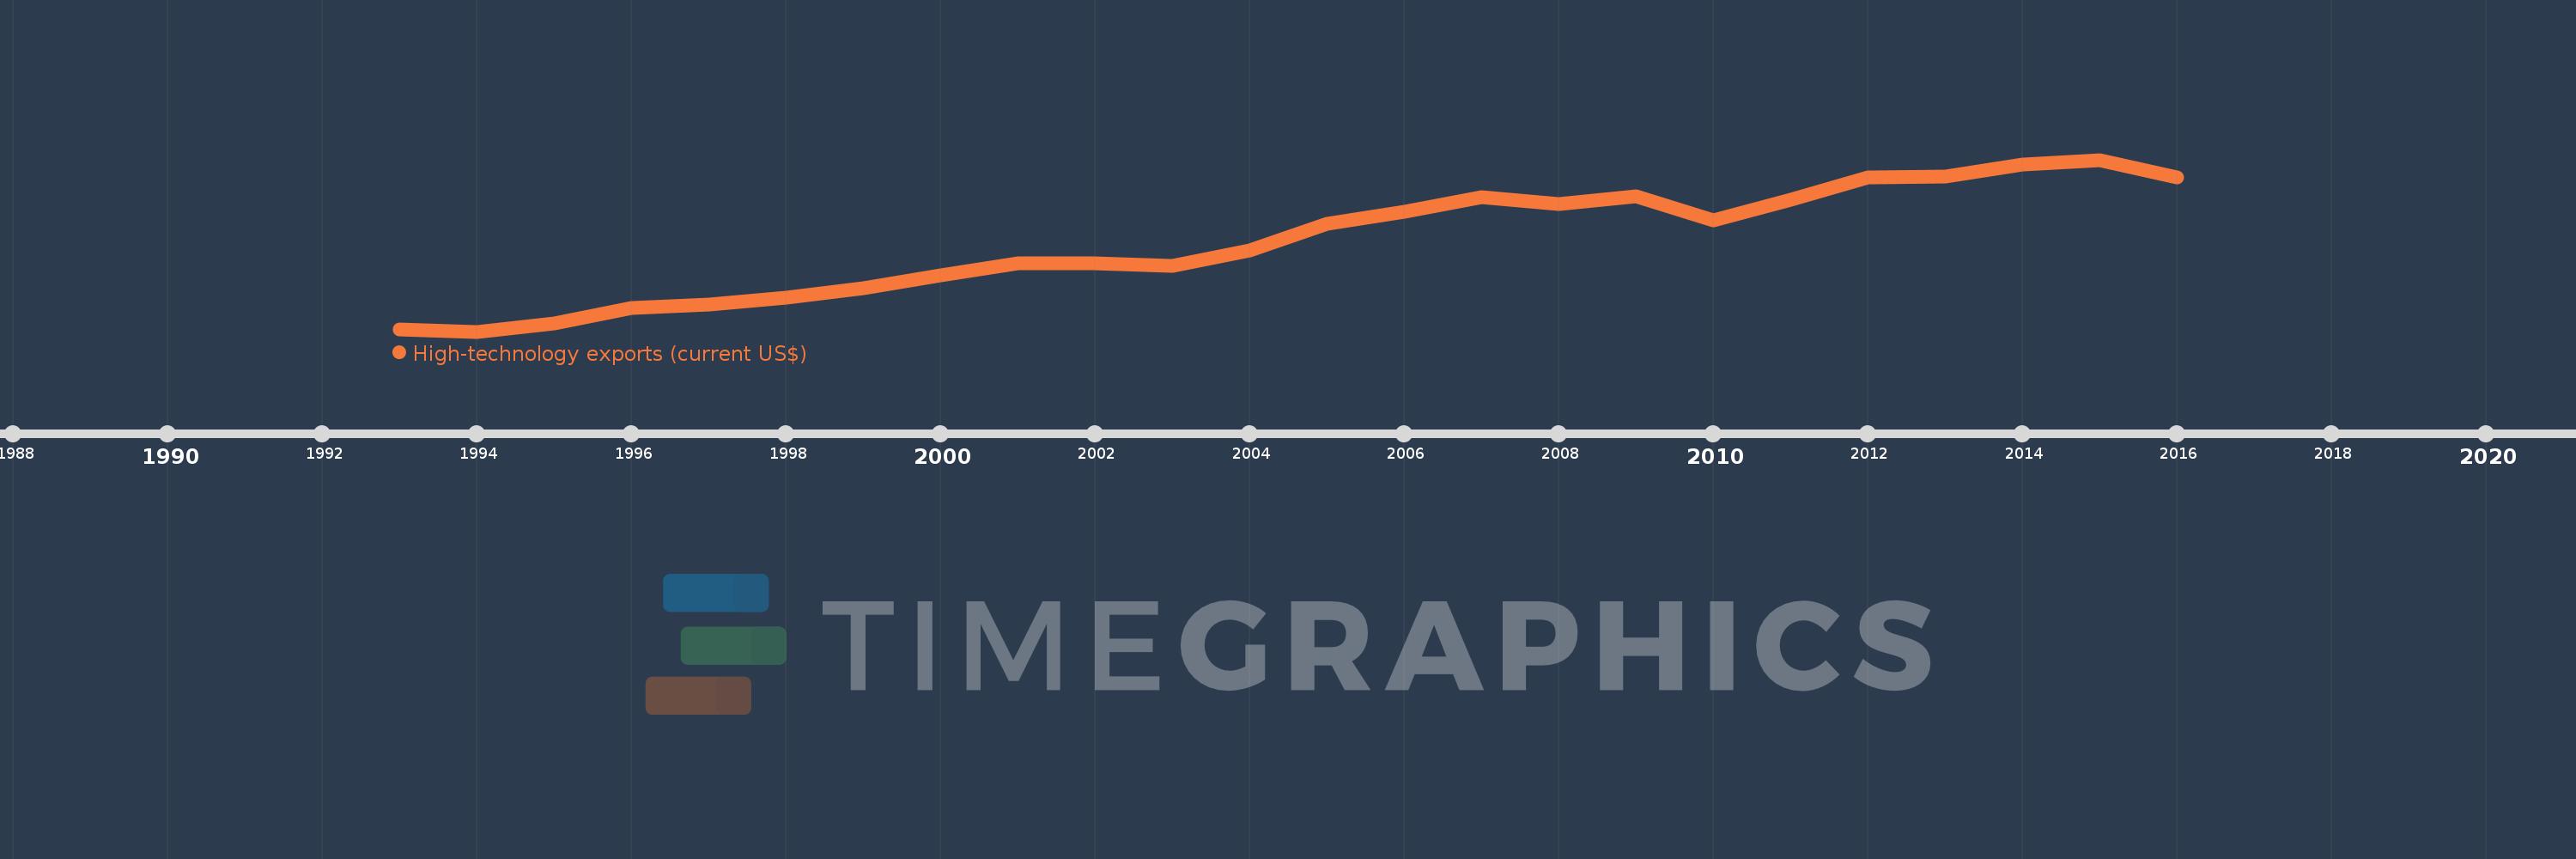
En esta escala de tiempo se presenta un gráfico de 1993 y 2016 de Euro area. Los datos de 1992 están ausentes. El número de observaciones reales por fecha: 24.
Fuente (nombre):
Indicadores del desarrollo mundial
Fuente (organización):
United Nations, Comtrade database.
Categorías:
Private Sector, Science & Technology, Trade
Se ha actualizado:
23 abr 2017 año
Los indicadores de los cambios de valor en los últimos años
En promedio:
338.451 bn
Mínimo:
122.404 bn
1 ene 1994 año
Máximo:
537.421 bn
1 ene 2015 año
A la fecha de observación
Valor
Cambio absoluto
El cambio con respecto al valor anterior
1 ene 1993 año
128.596 bn
+128.596 bn
0.0%
1 ene 1994 año
122.404 bn
-6.192 bn
-4.81%
1 ene 1995 año
141.371 bn
+18.967 bn
15.5%
1 ene 1996 año
179.065 bn
+37.694 bn
26.66%
1 ene 1997 año
187.377 bn
+8.312 bn
4.64%
1 ene 1998 año
204.776 bn
+17.399 bn
9.29%
1 ene 1999 año
226.694 bn
+21.918 bn
10.7%
1 ene 2000 año
258.365 bn
+31.671 bn
13.97%
1 ene 2001 año
287.81 bn
+29.445 bn
11.4%
1 ene 2002 año
286.706 bn
-1.104 bn
-0.38%
1 ene 2003 año
280.147 bn
-6.558 bn
-2.29%
1 ene 2004 año
318.963 bn
+38.816 bn
13.86%
1 ene 2005 año
382.698 bn
+63.735 bn
19.98%
1 ene 2006 año
412.242 bn
+29.544 bn
7.72%
1 ene 2007 año
446.564 bn
+34.322 bn
8.33%
1 ene 2008 año
429.639 bn
-16.925 bn
-3.79%
1 ene 2009 año
448.626 bn
+18.987 bn
4.42%
1 ene 2010 año
391.492 bn
-57.134 bn
-12.74%
1 ene 2011 año
440.152 bn
+48.66 bn
12.43%
1 ene 2012 año
495.469 bn
+55.317 bn
12.57%
1 ene 2013 año
496.509 bn
+1.041 bn
0.21%
1 ene 2014 año
525.507 bn
+28.997 bn
5.84%
1 ene 2015 año
537.421 bn
+11.914 bn
2.27%
1 ene 2016 año
494.225 bn
-43.196 bn
-8.04%
Ranking de los países por los datos estadísticos actuales

Comentarios:

Enviar
PremiumAbout & FeedbackAcuerdoPrivacidad
logo
© 2022 Selected Technologies LLC – Morgan Hill, California