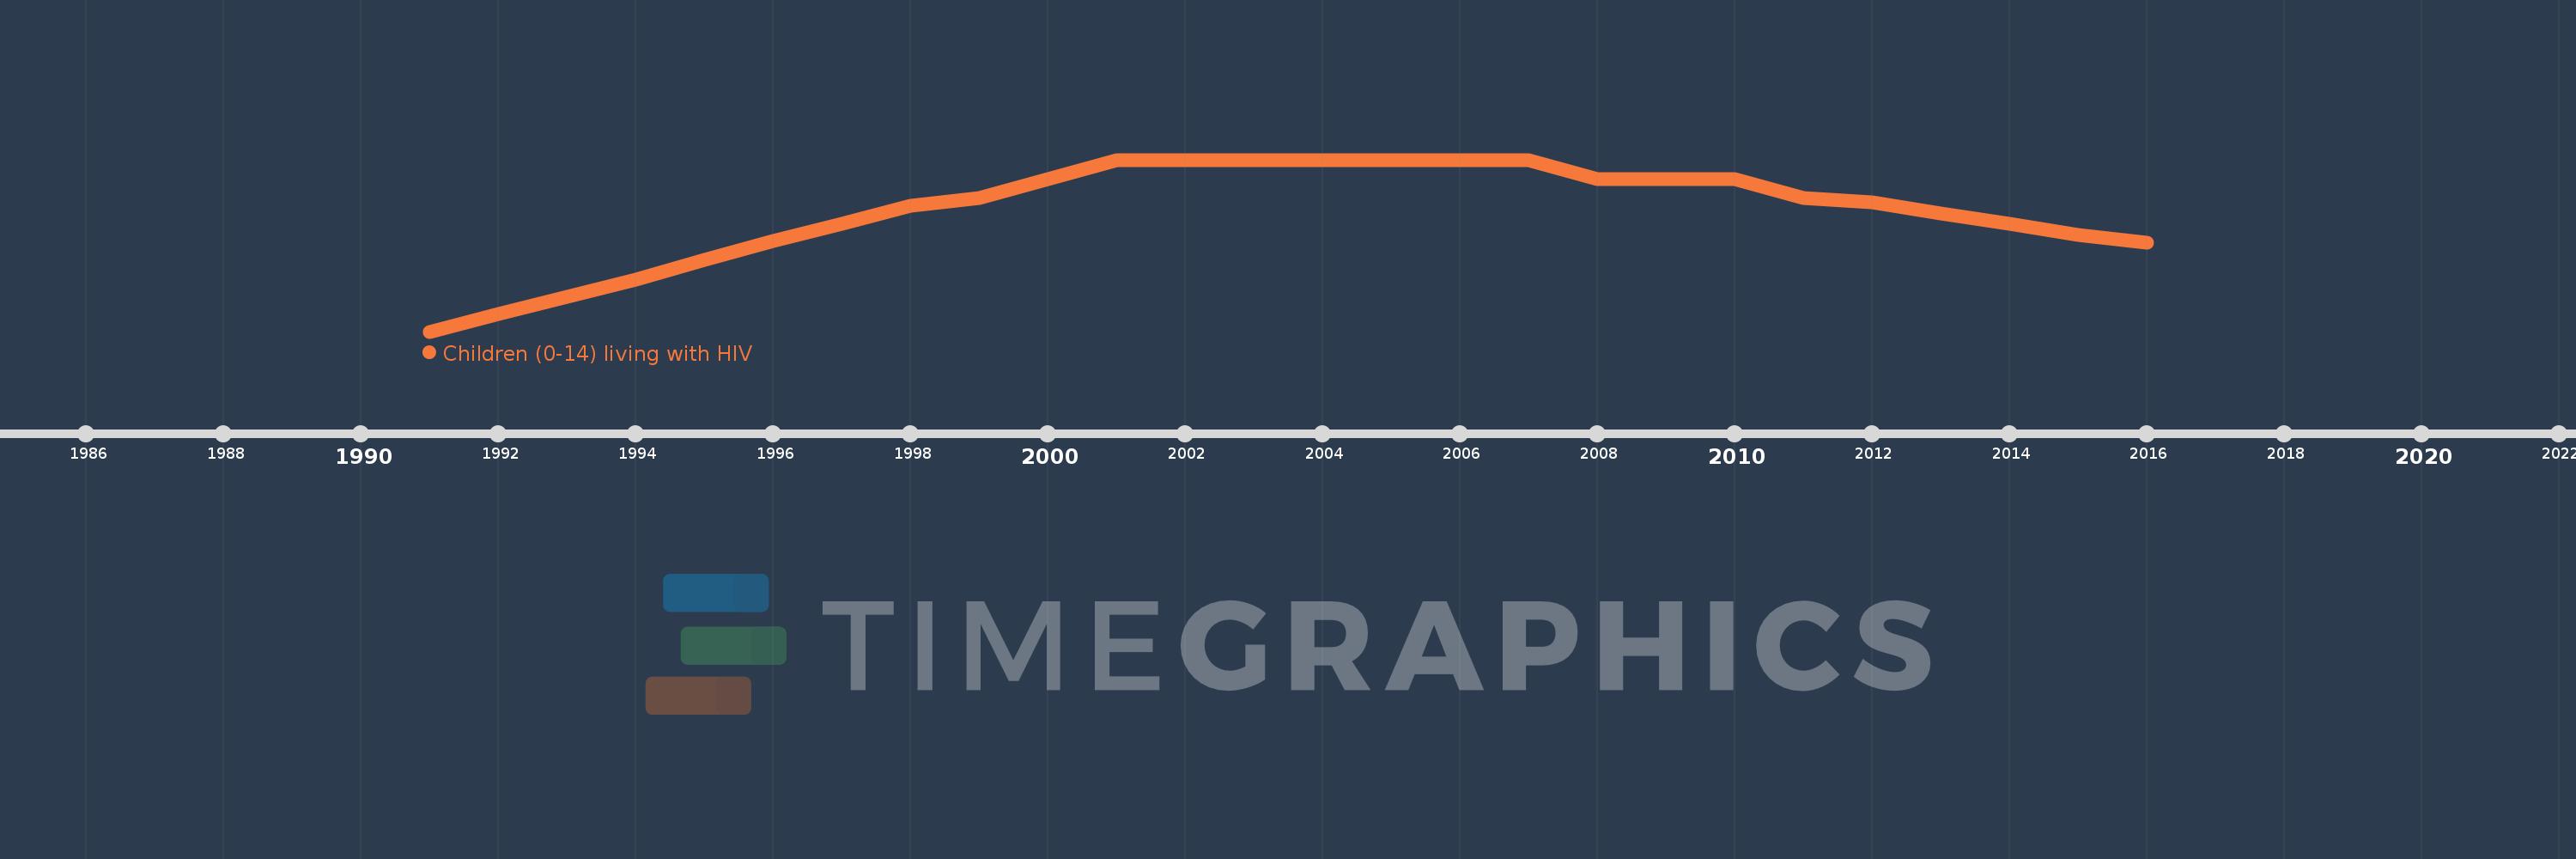
En esta escala de tiempo se presenta un gráfico de 1991 y 2016 de Zimbabwe. Los datos de 1990 están ausentes. El número de observaciones reales por fecha: 26.
Fuente (nombre):
Indicadores del desarrollo mundial
Fuente (organización):
UNAIDS estimates.
Categorías:
Health
Se ha actualizado:
23 abr 2017 año
Los indicadores de los cambios de valor en los últimos años
En promedio:
93.154 mil
Mínimo:
31.0 mil
1 ene 1991 año
Máximo:
120.0 mil
1 ene 2001 año
A la fecha de observación
Valor
Cambio absoluto
El cambio con respecto al valor anterior
1 ene 1991 año
31.0 mil
+31.0 mil
0.0%
1 ene 1992 año
40.0 mil
+9.0 mil
29.03%
1 ene 1993 año
49.0 mil
+9.0 mil
22.5%
1 ene 1994 año
58.0 mil
+9.0 mil
18.37%
1 ene 1995 año
68.0 mil
+10.0 mil
17.24%
1 ene 1996 año
78.0 mil
+10.0 mil
14.71%
1 ene 1997 año
87.0 mil
+9.0 mil
11.54%
1 ene 1998 año
96.0 mil
+9.0 mil
10.34%
1 ene 1999 año
100.0 mil
+4.0 mil
4.17%
1 ene 2000 año
110.0 mil
+10.0 mil
10.0%
1 ene 2001 año
120.0 mil
+10.0 mil
9.09%
1 ene 2002 año
120.0 mil
0.0
0.0%
1 ene 2003 año
120.0 mil
0.0
0.0%
1 ene 2004 año
120.0 mil
0.0
0.0%
1 ene 2005 año
120.0 mil
0.0
0.0%
1 ene 2006 año
120.0 mil
0.0
0.0%
1 ene 2007 año
120.0 mil
0.0
0.0%
1 ene 2008 año
110.0 mil
-10.0 mil
-8.33%
1 ene 2009 año
110.0 mil
0.0
0.0%
1 ene 2010 año
110.0 mil
0.0
0.0%
1 ene 2011 año
100.0 mil
-10.0 mil
-9.09%
1 ene 2012 año
98.0 mil
-2.0 mil
-2.0%
1 ene 2013 año
92.0 mil
-6.0 mil
-6.12%
1 ene 2014 año
87.0 mil
-5.0 mil
-5.43%
1 ene 2015 año
81.0 mil
-6.0 mil
-6.9%
1 ene 2016 año
77.0 mil
-4.0 mil
-4.94%
Ranking de los países por los datos estadísticos actuales