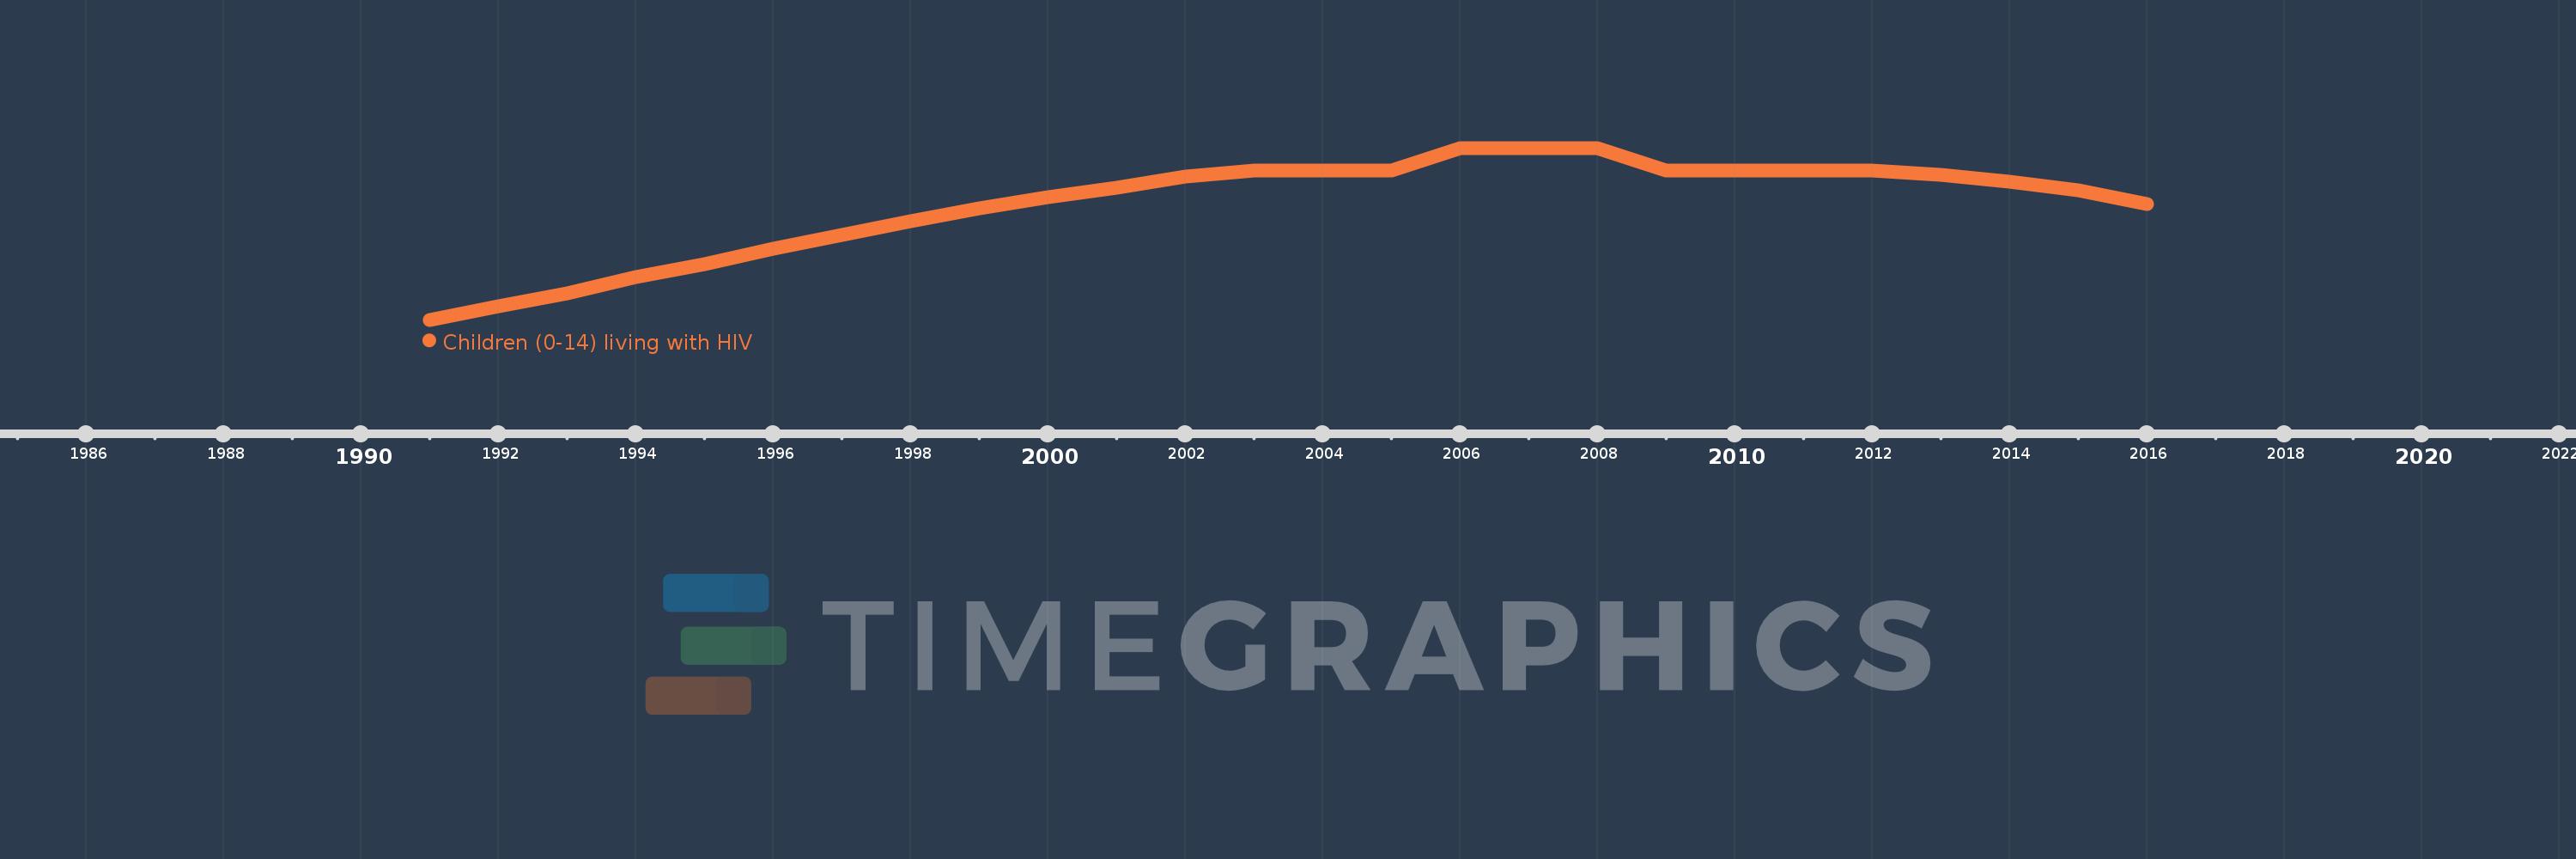
En esta escala de tiempo se presenta un gráfico de 1991 y 2016 de Zambia. Los datos de 1990 están ausentes. El número de observaciones reales por fecha: 26.
Fuente (nombre):
Indicadores del desarrollo mundial
Fuente (organización):
UNAIDS estimates.
Categorías:
Health
Se ha actualizado:
23 abr 2017 año
Los indicadores de los cambios de valor en los últimos años
En promedio:
84.577 mil
Mínimo:
33.0 mil
1 ene 1991 año
Máximo:
110.0 mil
1 ene 2006 año
A la fecha de observación
Valor
Cambio absoluto
El cambio con respecto al valor anterior
1 ene 1991 año
33.0 mil
+33.0 mil
0.0%
1 ene 1992 año
39.0 mil
+6.0 mil
18.18%
1 ene 1993 año
45.0 mil
+6.0 mil
15.38%
1 ene 1994 año
52.0 mil
+7.0 mil
15.56%
1 ene 1995 año
58.0 mil
+6.0 mil
11.54%
1 ene 1996 año
65.0 mil
+7.0 mil
12.07%
1 ene 1997 año
71.0 mil
+6.0 mil
9.23%
1 ene 1998 año
77.0 mil
+6.0 mil
8.45%
1 ene 1999 año
83.0 mil
+6.0 mil
7.79%
1 ene 2000 año
88.0 mil
+5.0 mil
6.02%
1 ene 2001 año
92.0 mil
+4.0 mil
4.55%
1 ene 2002 año
97.0 mil
+5.0 mil
5.43%
1 ene 2003 año
100.0 mil
+3.0 mil
3.09%
1 ene 2004 año
100.0 mil
0.0
0.0%
1 ene 2005 año
100.0 mil
0.0
0.0%
1 ene 2006 año
110.0 mil
+10.0 mil
10.0%
1 ene 2007 año
110.0 mil
0.0
0.0%
1 ene 2008 año
110.0 mil
0.0
0.0%
1 ene 2009 año
100.0 mil
-10.0 mil
-9.09%
1 ene 2010 año
100.0 mil
0.0
0.0%
1 ene 2011 año
100.0 mil
0.0
0.0%
1 ene 2012 año
100.0 mil
0.0
0.0%
1 ene 2013 año
98.0 mil
-2.0 mil
-2.0%
1 ene 2014 año
95.0 mil
-3.0 mil
-3.06%
1 ene 2015 año
91.0 mil
-4.0 mil
-4.21%
1 ene 2016 año
85.0 mil
-6.0 mil
-6.59%
Ranking de los países por los datos estadísticos actuales