33
/es/
AIzaSyAYiBZKx7MnpbEhh9jyipgxe19OcubqV5w
August 1, 2025
286357
Zambia
ZMB
true
2
1
Persistence to grade 5, male (% of cohort)
2013,2010,2009,2008,2007,2006,2000,1999,1985,1984,1983,1982,1981,1980,1979,1978,1977,1976,1975,1974,1973
Download
Estadísticas Globales de la Biblioteca →Zambia →

Persistence to grade 5, male (% of cohort)

Estas estadísticas en otros países:

AfghanistanAlbaniaAlgeriaAndorraAngolaAntigua and BarbudaArab WorldArgentinaArubaBahamas, TheBahrainBangladeshBarbadosBelgiumBelizeBeninBermudaBhutanBoliviaBosnia and HerzegovinaBotswanaBrunei DarussalamBurkina FasoBurundiCabo VerdeCambodiaCameroonCanadaCaribbean small statesCayman IslandsCentral African RepublicChadChileChinaColombiaComorosCongo, Dem. Rep.Congo, Rep.Costa RicaCote d'IvoireCubaCyprusCzech RepublicDenmarkDjiboutiDominicaDominican RepublicEarly-demographic dividendEast Asia & PacificEast Asia & Pacific (excluding high income)East Asia & Pacific (IDA & IBRD countries)EcuadorEgypt, Arab Rep.El SalvadorEquatorial GuineaEritreaEstoniaEthiopiaFijiFinlandFranceGabonGambia, TheGeorgiaGhanaGreeceGrenadaGuatemalaGuineaGuinea-BissauGuyanaHaitiHeavily indebted poor countries (HIPC)HondurasHong Kong SAR, ChinaHungaryIcelandIDA blendIDA onlyIDA totalIndiaIndonesiaIran, Islamic Rep.IraqIrelandIsraelItalyJamaicaJapanJordanKenyaKiribatiKorea, Rep.KuwaitLao PDRLate-demographic dividendLatviaLeast developed countries: UN classificationLebanonLesothoLiberiaLibyaLiechtensteinLow incomeLower middle incomeLuxembourgMacao SAR, ChinaMadagascarMalawiMalaysiaMaldivesMaliMaltaMarshall IslandsMauritaniaMauritiusMexicoMiddle East & North AfricaMiddle East & North Africa (excluding high income)Middle East & North Africa (IDA & IBRD countries)MontenegroMoroccoMozambiqueMyanmarNamibiaNepalNetherlandsNicaraguaNigerNigeriaNorwayOmanOther small statesPacific island small statesPakistanPanamaPapua New GuineaParaguayPeruPhilippinesPolandPortugalPre-demographic dividendQatarRwandaSamoaSan MarinoSao Tome and PrincipeSaudi ArabiaSenegalSeychellesSierra LeoneSingaporeSloveniaSolomon IslandsSouth AfricaSouth AsiaSouth Asia (IDA & IBRD)SpainSri LankaSt. Kitts and NevisSt. LuciaSt. Vincent and the GrenadinesSub-Saharan Africa Sub-Saharan Africa (excluding high income)Sub-Saharan Africa (IDA & IBRD countries)SudanSurinameSwazilandSwedenSwitzerlandSyrian Arab RepublicTanzaniaThailandTimor-LesteTogoTongaTrinidad and TobagoTunisiaTurkeyUgandaUnited Arab EmiratesUpper middle incomeUruguayVanuatuVenezuela, RBVietnamYemen, Rep.ZambiaZimbabwe

línea de tiempo (timeline):

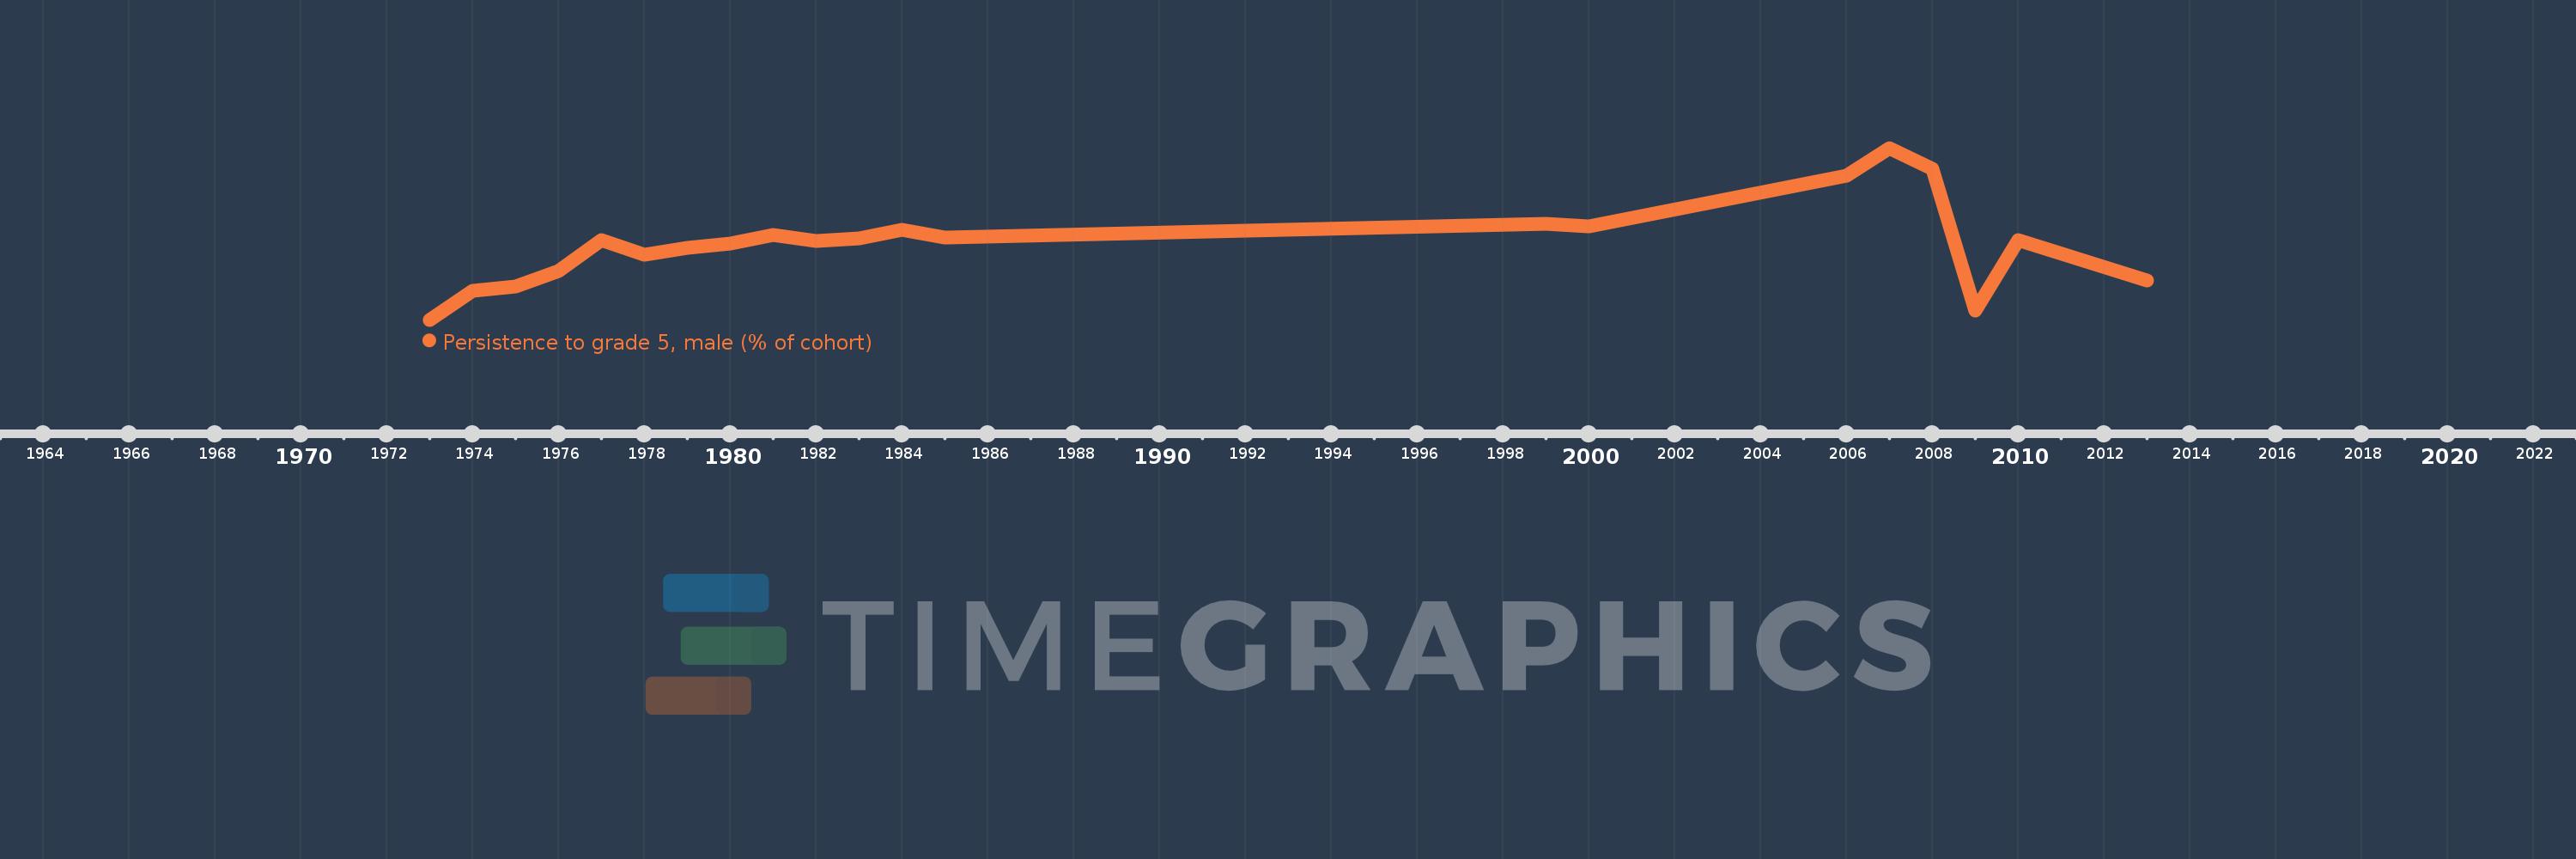
En esta escala de tiempo se presenta un gráfico de 1973 y 2013 de Zambia. Los datos de 1972 están ausentes. El número de observaciones reales por fecha: 21.

Fuente (nombre):

Indicadores del desarrollo mundial

Fuente (organización):

United Nations Educational, Scientific, and Cultural Organization (UNESCO) Institute for Statistics.

Categorías:

Education, Gender

Se ha actualizado:

23 abr 2017 año

Los indicadores de los cambios de valor en los últimos años

En promedio:
80.747
Mínimo:
70.287
1 ene 1973 año
Máximo:
93.792
1 ene 2007 año
A la fecha de observación
Valor
Cambio absoluto
El cambio con respecto al valor anterior
1 ene 1973 año
70.287
+70.287
0.0%
1 ene 1974 año
74.247
+3.96
5.63%
1 ene 1975 año
74.812
+0.565
0.76%
1 ene 1976 año
76.947
+2.135
2.85%
1 ene 1977 año
81.173
+4.226
5.49%
1 ene 1978 año
79.176
-1.997
-2.46%
1 ene 1979 año
80.158
+0.982
1.24%
1 ene 1980 año
80.749
+0.592
0.74%
1 ene 1981 año
81.882
+1.133
1.4%
1 ene 1982 año
81.067
-0.815
-0.99%
1 ene 1983 año
81.464
+0.396
0.49%
1 ene 1984 año
82.563
+1.099
1.35%
1 ene 1985 año
81.564
-0.999
-1.21%
1 ene 1999 año
83.46
+1.896
2.32%
1 ene 2000 año
83.059
-0.401
-0.48%
1 ene 2006 año
89.96
+6.901
8.31%
1 ene 2007 año
93.792
+3.832
4.26%
1 ene 2008 año
90.972
-2.82
-3.01%
1 ene 2009 año
71.496
-19.477
-21.41%
1 ene 2010 año
81.214
+9.718
13.59%
1 ene 2013 año
75.65
-5.563
-6.85%

Ranking de los países por los datos estadísticos actuales