33
/es/
AIzaSyAYiBZKx7MnpbEhh9jyipgxe19OcubqV5w
August 1, 2025
281455
Venezuela, RB
VEN
true
2
1
Persistence to grade 5, male (% of cohort)
2014,2013,2012,2011,2010,2009,2008,2007,2006,2005,2004,2003,2000,1998,1997,1994,1993,1992,1990,1989
Download
Estadísticas Globales de la Biblioteca →Venezuela, RB →

Persistence to grade 5, male (% of cohort)

Estas estadísticas en otros países:

AfghanistanAlbaniaAlgeriaAndorraAngolaAntigua and BarbudaArab WorldArgentinaArubaBahamas, TheBahrainBangladeshBarbadosBelgiumBelizeBeninBermudaBhutanBoliviaBosnia and HerzegovinaBotswanaBrunei DarussalamBurkina FasoBurundiCabo VerdeCambodiaCameroonCanadaCaribbean small statesCayman IslandsCentral African RepublicChadChileChinaColombiaComorosCongo, Dem. Rep.Congo, Rep.Costa RicaCote d'IvoireCubaCyprusCzech RepublicDenmarkDjiboutiDominicaDominican RepublicEarly-demographic dividendEast Asia & PacificEast Asia & Pacific (excluding high income)East Asia & Pacific (IDA & IBRD countries)EcuadorEgypt, Arab Rep.El SalvadorEquatorial GuineaEritreaEstoniaEthiopiaFijiFinlandFranceGabonGambia, TheGeorgiaGhanaGreeceGrenadaGuatemalaGuineaGuinea-BissauGuyanaHaitiHeavily indebted poor countries (HIPC)HondurasHong Kong SAR, ChinaHungaryIcelandIDA blendIDA onlyIDA totalIndiaIndonesiaIran, Islamic Rep.IraqIrelandIsraelItalyJamaicaJapanJordanKenyaKiribatiKorea, Rep.KuwaitLao PDRLate-demographic dividendLatviaLeast developed countries: UN classificationLebanonLesothoLiberiaLibyaLiechtensteinLow incomeLower middle incomeLuxembourgMacao SAR, ChinaMadagascarMalawiMalaysiaMaldivesMaliMaltaMarshall IslandsMauritaniaMauritiusMexicoMiddle East & North AfricaMiddle East & North Africa (excluding high income)Middle East & North Africa (IDA & IBRD countries)MontenegroMoroccoMozambiqueMyanmarNamibiaNepalNetherlandsNicaraguaNigerNigeriaNorwayOmanOther small statesPacific island small statesPakistanPanamaPapua New GuineaParaguayPeruPhilippinesPolandPortugalPre-demographic dividendQatarRwandaSamoaSan MarinoSao Tome and PrincipeSaudi ArabiaSenegalSeychellesSierra LeoneSingaporeSloveniaSolomon IslandsSouth AfricaSouth AsiaSouth Asia (IDA & IBRD)SpainSri LankaSt. Kitts and NevisSt. LuciaSt. Vincent and the GrenadinesSub-Saharan Africa Sub-Saharan Africa (excluding high income)Sub-Saharan Africa (IDA & IBRD countries)SudanSurinameSwazilandSwedenSwitzerlandSyrian Arab RepublicTanzaniaThailandTimor-LesteTogoTongaTrinidad and TobagoTunisiaTurkeyUgandaUnited Arab EmiratesUpper middle incomeUruguayVanuatuVenezuela, RBVietnamYemen, Rep.ZambiaZimbabwe

línea de tiempo (timeline):

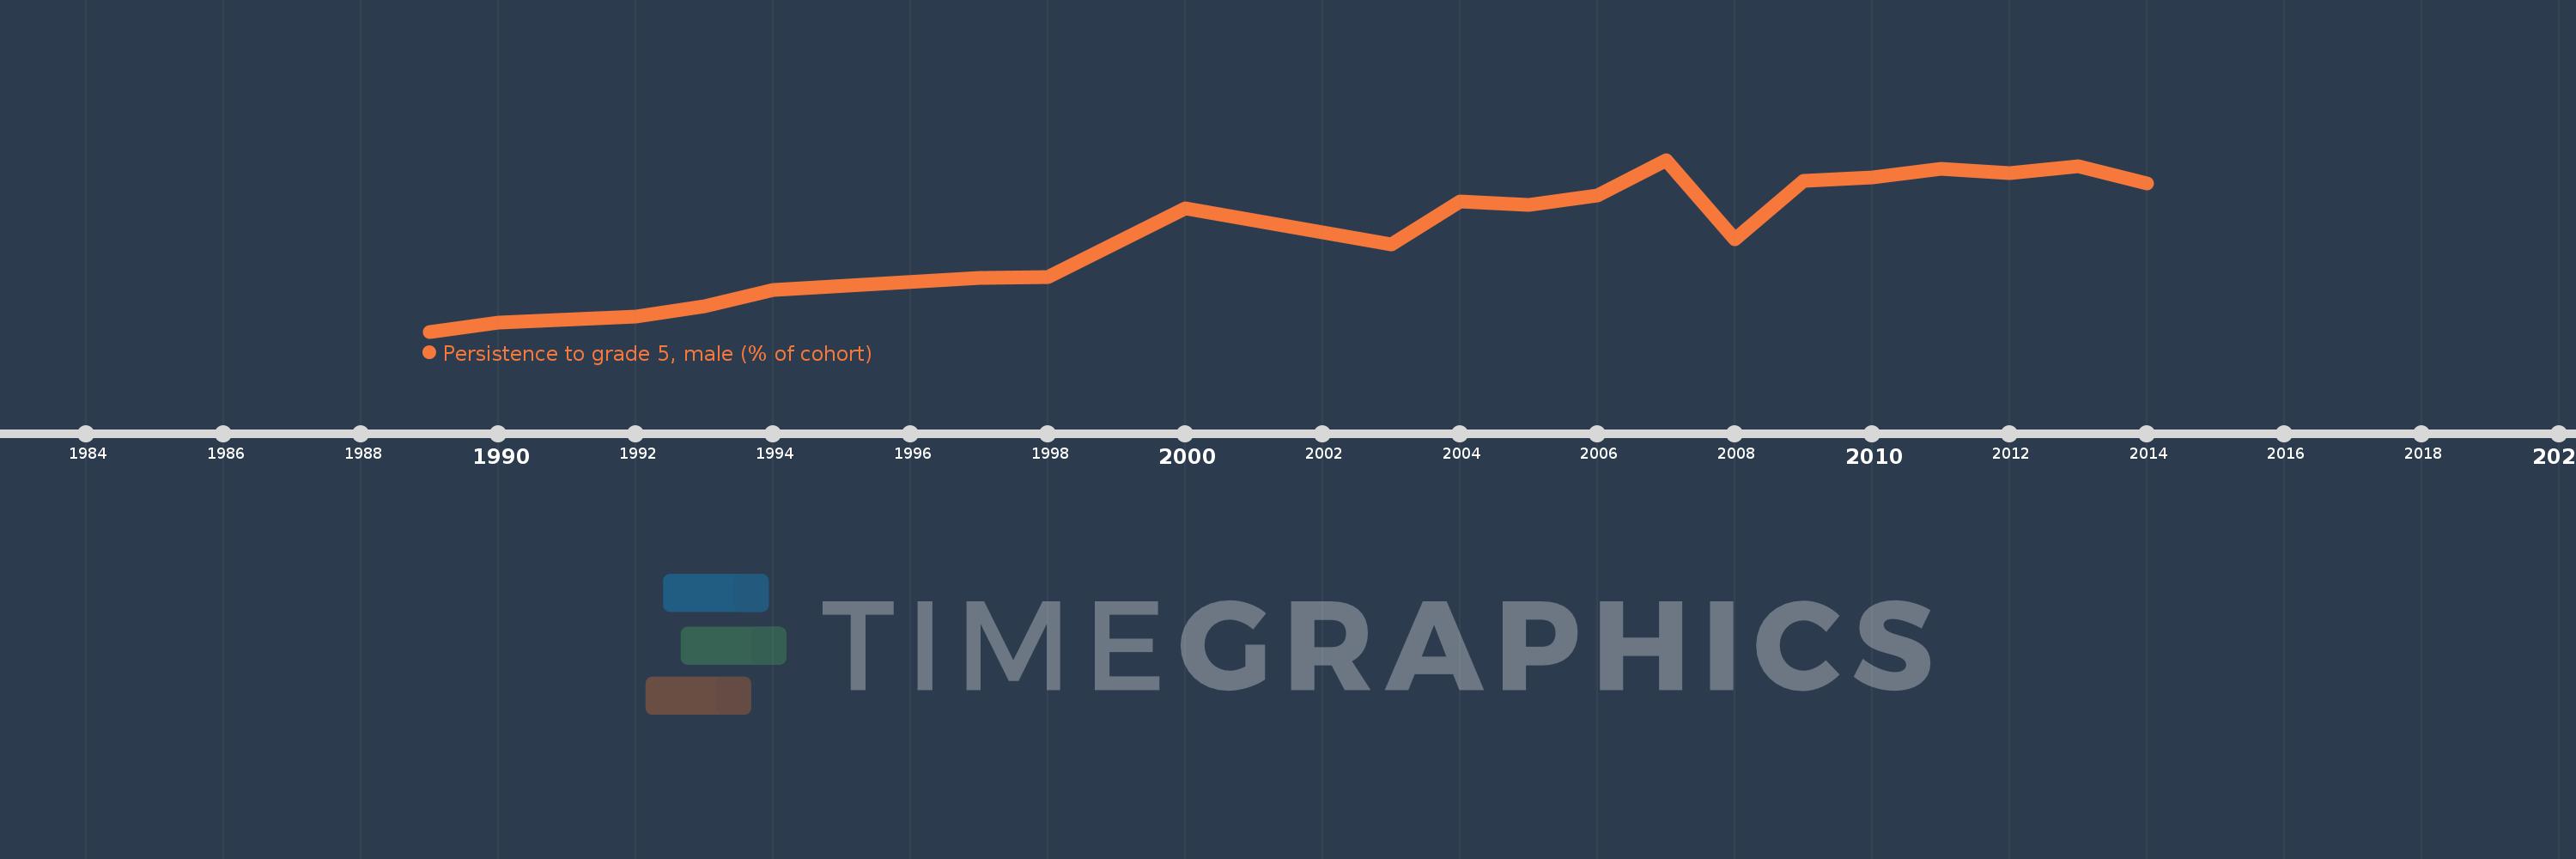
En esta escala de tiempo se presenta un gráfico de 1989 y 2014 de Venezuela, RB. Los datos de 1988 están ausentes. El número de observaciones reales por fecha: 20.

Fuente (nombre):

Indicadores del desarrollo mundial

Fuente (organización):

United Nations Educational, Scientific, and Cultural Organization (UNESCO) Institute for Statistics.

Categorías:

Education, Gender

Se ha actualizado:

23 abr 2017 año

Los indicadores de los cambios de valor en los últimos años

En promedio:
83.646
Mínimo:
66.83
1 ene 1989 año
Máximo:
95.628
1 ene 2007 año
A la fecha de observación
Valor
Cambio absoluto
El cambio con respecto al valor anterior
1 ene 1989 año
66.83
+66.83
0.0%
1 ene 1990 año
68.287
+1.457
2.18%
1 ene 1992 año
69.359
+1.072
1.57%
1 ene 1993 año
71.086
+1.727
2.49%
1 ene 1994 año
73.776
+2.69
3.78%
1 ene 1997 año
75.86
+2.084
2.82%
1 ene 1998 año
75.996
+0.136
0.18%
1 ene 2000 año
87.523
+11.527
15.17%
1 ene 2003 año
81.483
-6.04
-6.9%
1 ene 2004 año
88.587
+7.104
8.72%
1 ene 2005 año
88.081
-0.506
-0.57%
1 ene 2006 año
89.716
+1.635
1.86%
1 ene 2007 año
95.628
+5.911
6.59%
1 ene 2008 año
82.275
-13.353
-13.96%
1 ene 2009 año
92.14
+9.865
11.99%
1 ene 2010 año
92.637
+0.497
0.54%
1 ene 2011 año
94.127
+1.49
1.61%
1 ene 2012 año
93.33
-0.797
-0.85%
1 ene 2013 año
94.577
+1.247
1.34%
1 ene 2014 año
91.63
-2.947
-3.12%

Ranking de los países por los datos estadísticos actuales