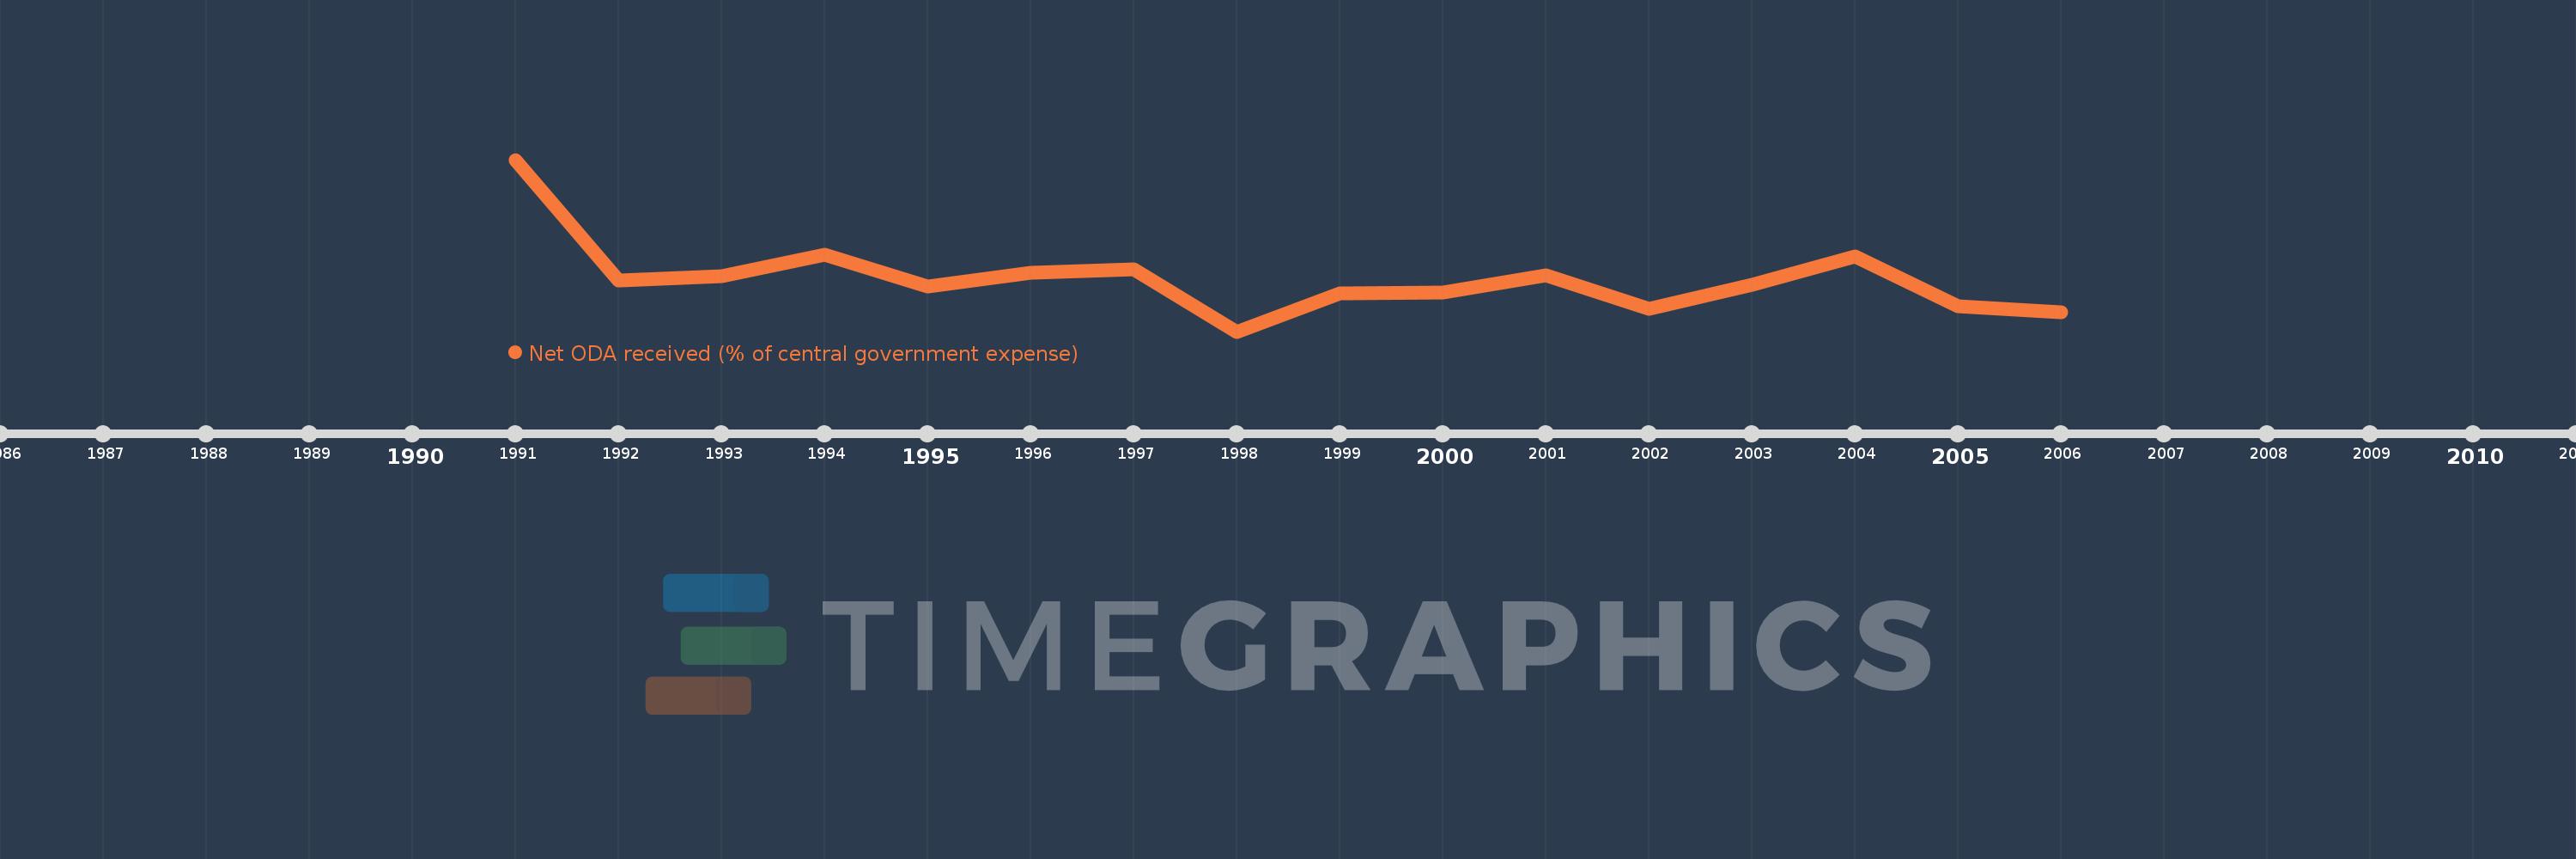
En esta escala de tiempo se presenta un gráfico de 1991 y 2006 de Venezuela, RB. Los datos de 1990 están ausentes. El número de observaciones reales por fecha: 16.
Fuente (nombre):
Indicadores del desarrollo mundial
Fuente (organización):
Development Assistance Committee of the Organisation for Economic Co-operation and Development, Geographical Distribution of Financial Flows to Developing Countries, Development Co-operation Report, and International Development Statistics database. Data are available online at: www.oecd.org/dac/stats/idsonline. IMF central government expense estimates are used for the denominator.
Categorías:
Aid Effectiveness
Se ha actualizado:
23 abr 2017 año
Los indicadores de los cambios de valor en los últimos años
En promedio:
0.286
Mínimo:
0.051
1 ene 1998 año
Máximo:
0.815
1 ene 1991 año
A la fecha de observación
Valor
Cambio absoluto
El cambio con respecto al valor anterior
1 ene 1991 año
0.815
+0.815
0.0%
1 ene 1992 año
0.277
-0.539
-66.07%
1 ene 1993 año
0.296
+0.019
6.89%
1 ene 1994 año
0.392
+0.096
32.54%
1 ene 1995 año
0.253
-0.139
-35.53%
1 ene 1996 año
0.313
+0.06
23.87%
1 ene 1997 año
0.329
+0.016
5.09%
1 ene 1998 año
0.051
-0.278
-84.47%
1 ene 1999 año
0.221
+0.169
331.82%
1 ene 2000 año
0.226
+0.005
2.48%
1 ene 2001 año
0.3
+0.074
32.76%
1 ene 2002 año
0.151
-0.149
-49.69%
1 ene 2003 año
0.261
+0.11
72.86%
1 ene 2004 año
0.386
+0.125
47.77%
1 ene 2005 año
0.162
-0.224
-58.08%
1 ene 2006 año
0.138
-0.024
-14.68%
Ranking de los países por los datos estadísticos actuales