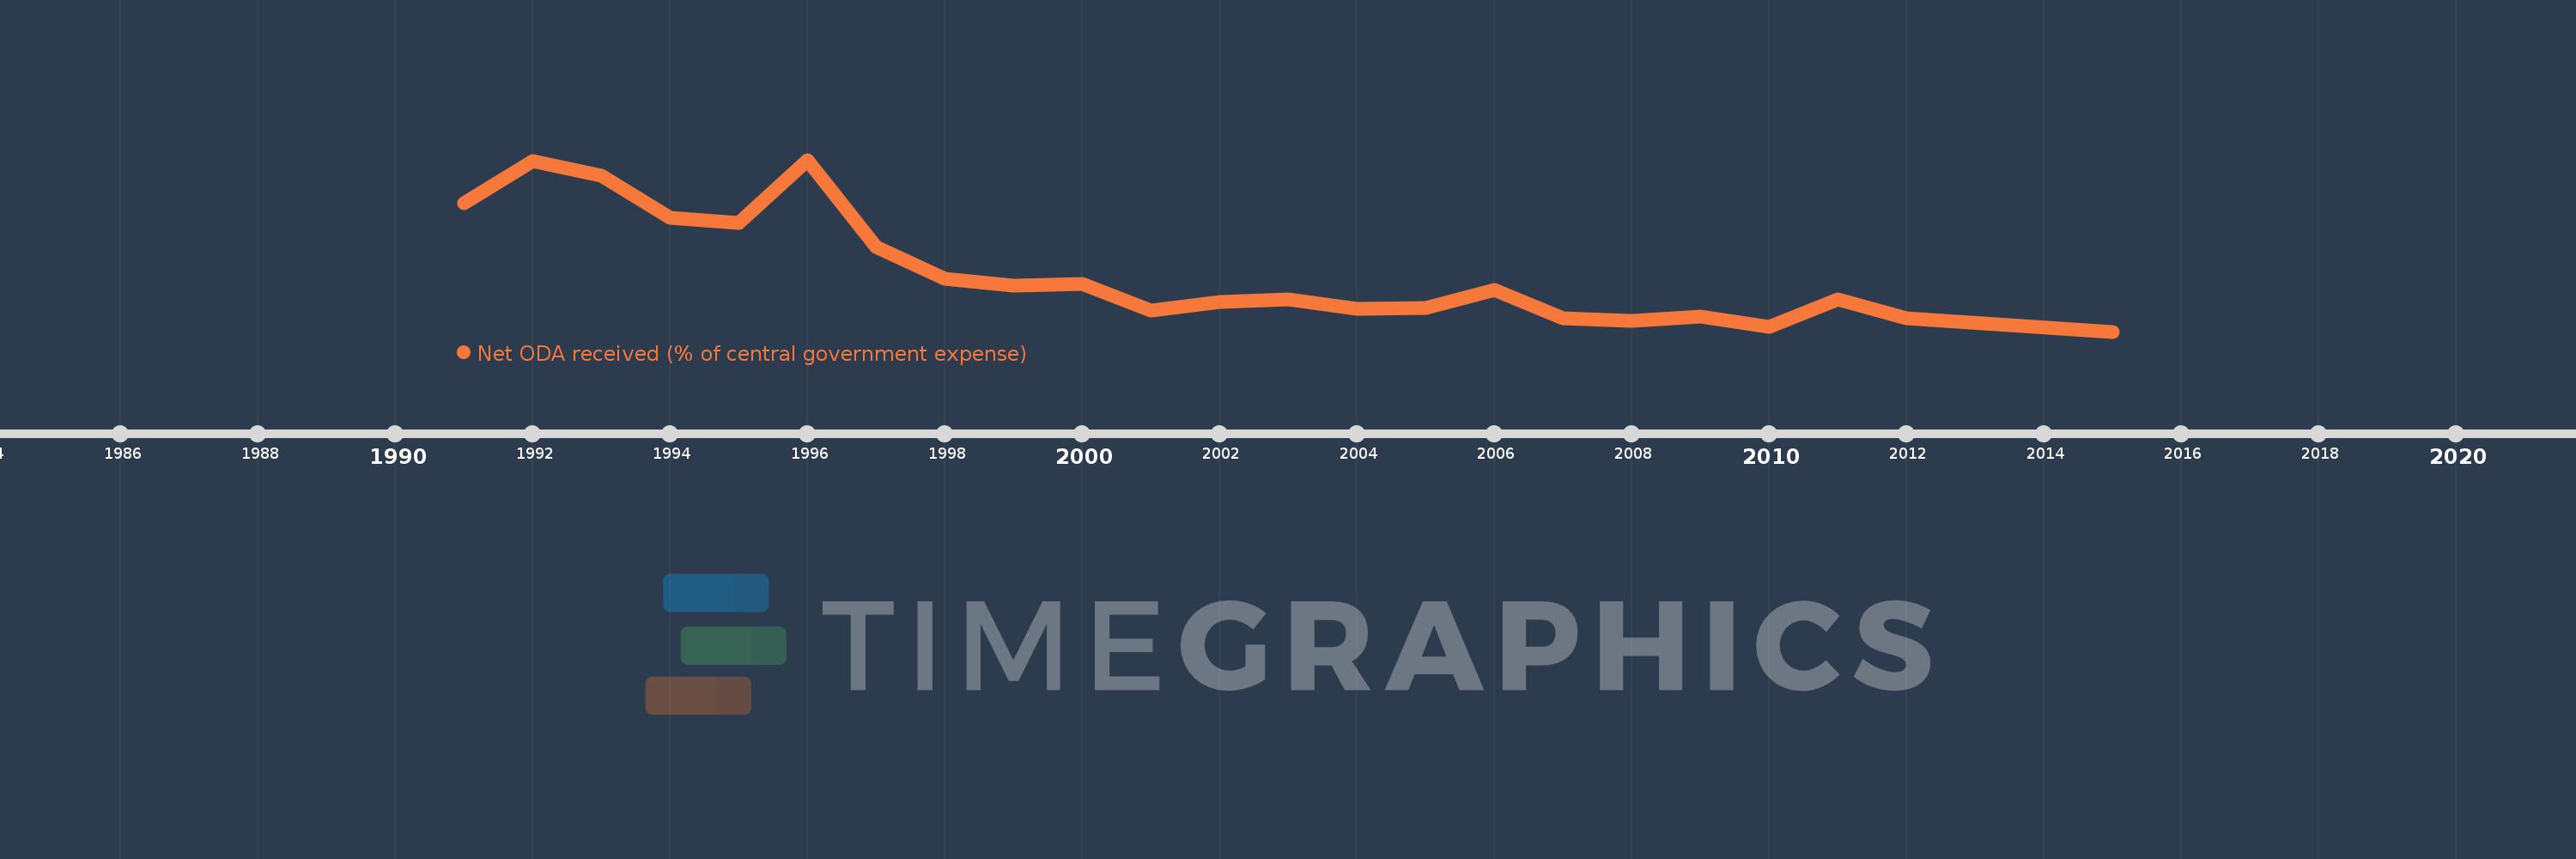
En esta escala de tiempo se presenta un gráfico de 1991 y 2015 de Maldives. Los datos de 1990 están ausentes. El número de observaciones reales por fecha: 23.
Fuente (nombre):
Indicadores del desarrollo mundial
Fuente (organización):
Development Assistance Committee of the Organisation for Economic Co-operation and Development, Geographical Distribution of Financial Flows to Developing Countries, Development Co-operation Report, and International Development Statistics database. Data are available online at: www.oecd.org/dac/stats/idsonline. IMF central government expense estimates are used for the denominator.
Categorías:
Aid Effectiveness
Se ha actualizado:
23 abr 2017 año
Los indicadores de los cambios de valor en los últimos años
En promedio:
28.051
Mínimo:
2.674
1 ene 2015 año
Máximo:
77.408
1 ene 1996 año
A la fecha de observación
Valor
Cambio absoluto
El cambio con respecto al valor anterior
1 ene 1991 año
58.455
+58.455
0.0%
1 ene 1992 año
76.738
+18.283
31.28%
1 ene 1993 año
70.323
-6.415
-8.36%
1 ene 1994 año
52.355
-17.968
-25.55%
1 ene 1995 año
49.784
-2.571
-4.91%
1 ene 1996 año
77.408
+27.624
55.49%
1 ene 1997 año
39.558
-37.85
-48.9%
1 ene 1998 año
25.79
-13.767
-34.8%
1 ene 1999 año
22.671
-3.119
-12.09%
1 ene 2000 año
23.365
+0.694
3.06%
1 ene 2001 año
12.015
-11.35
-48.58%
1 ene 2002 año
15.379
+3.364
28.0%
1 ene 2003 año
16.663
+1.284
8.35%
1 ene 2004 año
12.682
-3.981
-23.89%
1 ene 2005 año
12.96
+0.279
2.2%
1 ene 2006 año
20.901
+7.941
61.27%
1 ene 2007 año
8.564
-12.337
-59.03%
1 ene 2008 año
7.311
-1.253
-14.63%
1 ene 2009 año
9.328
+2.017
27.59%
1 ene 2010 año
4.848
-4.48
-48.02%
1 ene 2011 año
16.82
+11.971
246.91%
1 ene 2012 año
8.579
-8.241
-49.0%
1 ene 2015 año
2.674
-5.905
-68.83%
Ranking de los países por los datos estadísticos actuales