33
/es/
AIzaSyAYiBZKx7MnpbEhh9jyipgxe19OcubqV5w
May 1, 2025
280982
Venezuela, RB
VEN
true
2
1
GDP, PPP (current international $)
2015,2014,2013,2012,2011,2010,2009,2008,2007,2006,2005,2004,2003,2002,2001,2000,1999,1998,1997,1996,1995,1994,1993,1992,1991
Download
Estadísticas Globales de la Biblioteca →Venezuela, RB →

GDP, PPP (current international $)

Estas estadísticas en otros países:

AfghanistanAlbaniaAlgeriaAngolaAntigua and BarbudaArab WorldArgentinaArmeniaArubaAustraliaAustriaAzerbaijanBahamas, TheBahrainBangladeshBarbadosBelarusBelgiumBelizeBeninBermudaBhutanBoliviaBosnia and HerzegovinaBotswanaBrazilBrunei DarussalamBulgariaBurkina FasoBurundiCabo VerdeCambodiaCameroonCanadaCaribbean small statesCayman IslandsCentral African RepublicCentral Europe and the BalticsChadChileChinaColombiaComorosCongo, Dem. Rep.Congo, Rep.Costa RicaCote d'IvoireCroatiaCubaCyprusCzech RepublicDenmarkDjiboutiDominicaDominican RepublicEarly-demographic dividendEast Asia & PacificEast Asia & Pacific (excluding high income)East Asia & Pacific (IDA & IBRD countries)EcuadorEgypt, Arab Rep.El SalvadorEquatorial GuineaEritreaEstoniaEthiopiaEuro areaEurope & Central AsiaEurope & Central Asia (excluding high income)Europe & Central Asia (IDA & IBRD countries)European UnionFijiFinlandFragile and conflict affected situationsFranceGabonGambia, TheGeorgiaGermanyGhanaGreeceGrenadaGuatemalaGuineaGuinea-BissauGuyanaHaitiHeavily indebted poor countries (HIPC)High incomeHondurasHong Kong SAR, ChinaHungaryIBRD onlyIcelandIDA & IBRD totalIDA blendIDA onlyIDA totalIndiaIndonesiaIran, Islamic Rep.IraqIrelandIsraelItalyJamaicaJapanJordanKazakhstanKenyaKiribatiKorea, Rep.KosovoKuwaitKyrgyz RepublicLao PDRLate-demographic dividendLatin America & Caribbean Latin America & Caribbean (excluding high income)Latin America & the Caribbean (IDA & IBRD countries)LatviaLeast developed countries: UN classificationLebanonLesothoLiberiaLibyaLithuaniaLow & middle incomeLow incomeLower middle incomeLuxembourgMacao SAR, ChinaMacedonia, FYRMadagascarMalawiMalaysiaMaldivesMaliMaltaMarshall IslandsMauritaniaMauritiusMexicoMicronesia, Fed. Sts.Middle East & North AfricaMiddle East & North Africa (excluding high income)Middle East & North Africa (IDA & IBRD countries)Middle incomeMoldovaMongoliaMontenegroMoroccoMozambiqueMyanmarNamibiaNauruNepalNetherlandsNew ZealandNicaraguaNigerNigeriaNorth AmericaNorwayOECD membersOmanOther small statesPacific island small statesPakistanPalauPanamaPapua New GuineaParaguayPeruPhilippinesPolandPortugalPost-demographic dividendPre-demographic dividendPuerto RicoQatarRomaniaRussian FederationRwandaSamoaSao Tome and PrincipeSaudi ArabiaSenegalSerbiaSeychellesSierra LeoneSingaporeSint Maarten (Dutch part)Slovak RepublicSloveniaSmall statesSolomon IslandsSouth AfricaSouth AsiaSouth Asia (IDA & IBRD)South SudanSpainSri LankaSt. Kitts and NevisSt. LuciaSt. Vincent and the GrenadinesSub-Saharan Africa Sub-Saharan Africa (excluding high income)Sub-Saharan Africa (IDA & IBRD countries)SudanSurinameSwazilandSwedenSwitzerlandTajikistanTanzaniaThailandTimor-LesteTogoTongaTrinidad and TobagoTunisiaTurkeyTurkmenistanTuvaluUgandaUkraineUnited Arab EmiratesUnited KingdomUnited StatesUpper middle incomeUruguayUzbekistanVanuatuVenezuela, RBVietnamWest Bank and GazaWorldYemen, Rep.ZambiaZimbabwe

línea de tiempo (timeline):

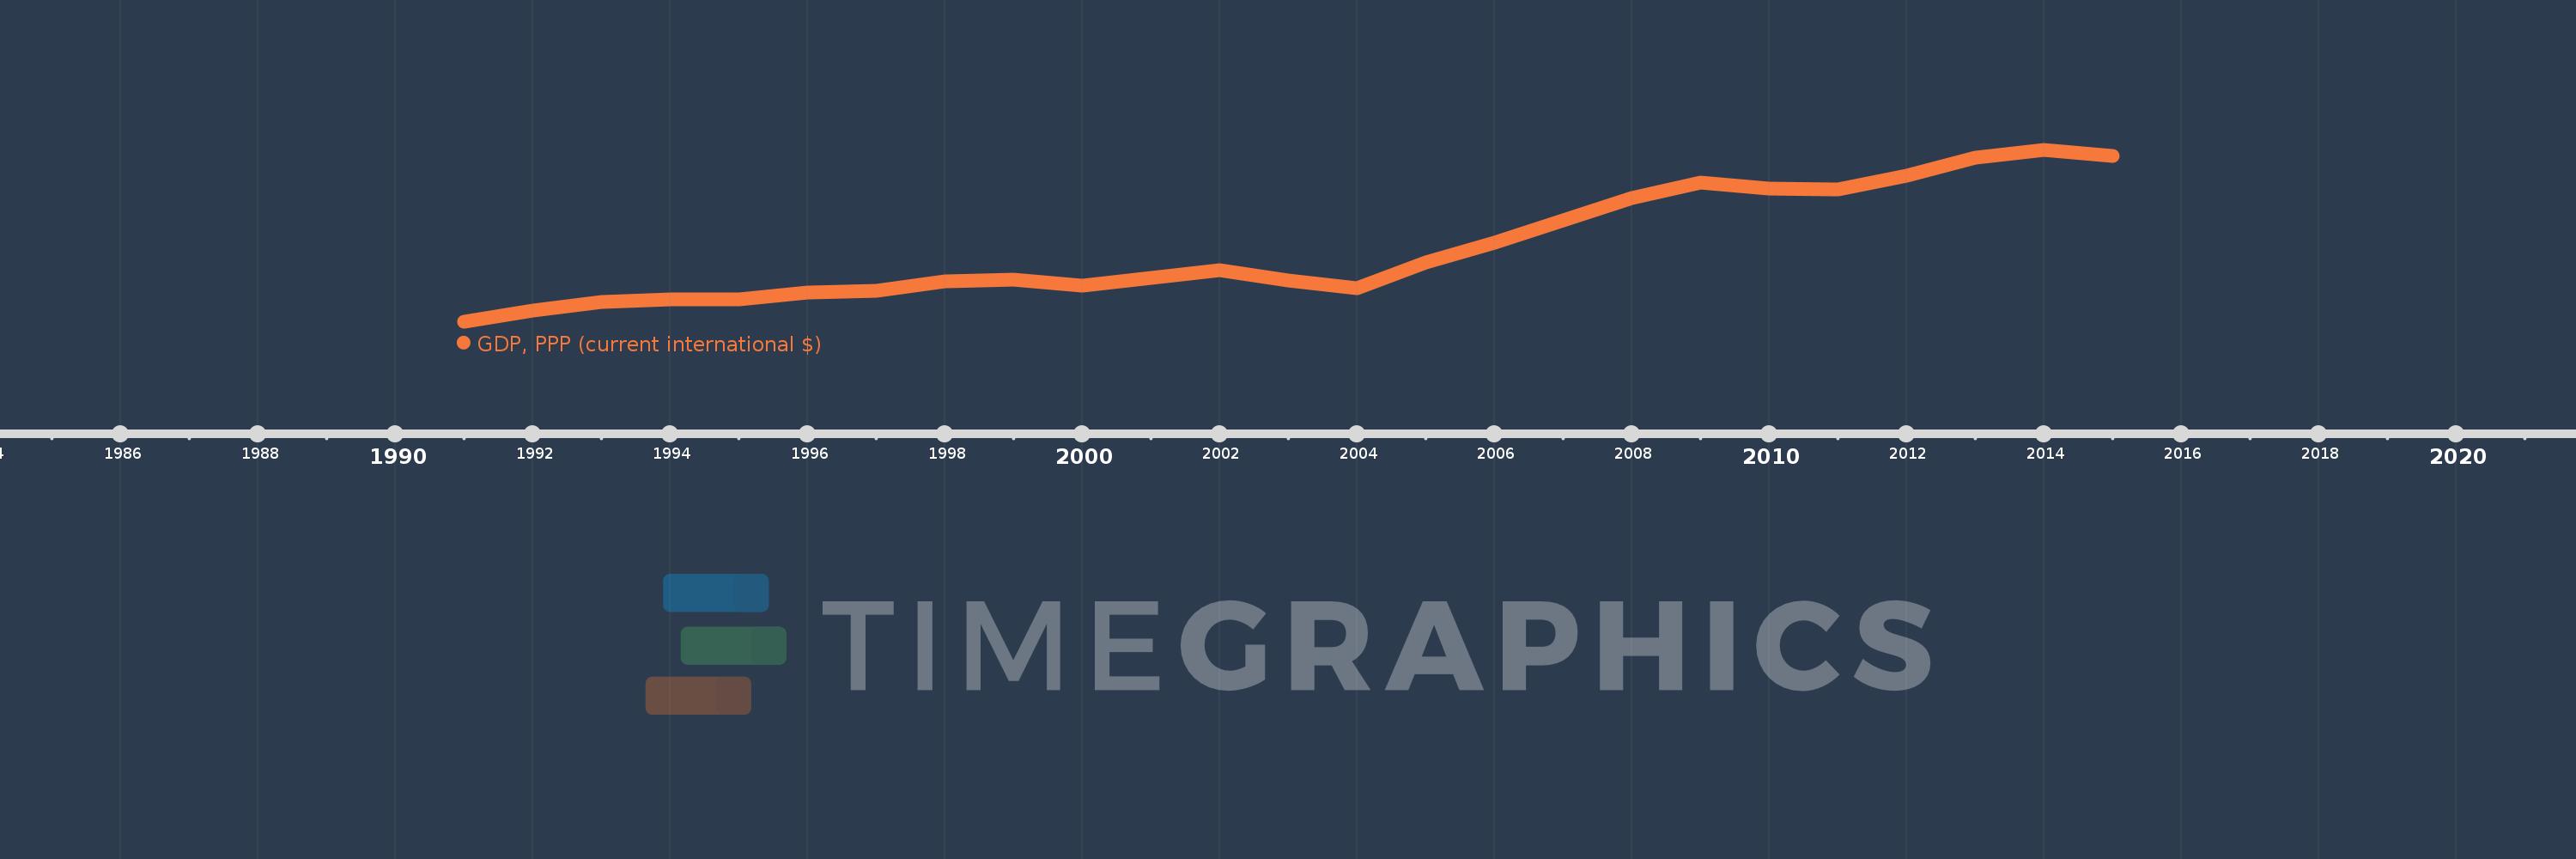
En esta escala de tiempo se presenta un gráfico de 1991 y 2015 de Venezuela, RB. Los datos de 1990 están ausentes. El número de observaciones reales por fecha: 25.

Fuente (nombre):

Indicadores del desarrollo mundial

Fuente (organización):

World Bank, International Comparison Program database.

Categorías:

Economy & Growth

Se ha actualizado:

23 abr 2017 año

Los indicadores de los cambios de valor en los últimos años

En promedio:
343.866 bn
Mínimo:
185.51 bn
1 ene 1991 año
Máximo:
554.246 bn
1 ene 2014 año
A la fecha de observación
Valor
Cambio absoluto
El cambio con respecto al valor anterior
1 ene 1991 año
185.51 bn
+185.51 bn
0.0%
1 ene 1992 año
210.335 bn
+24.825 bn
13.38%
1 ene 1993 año
228.168 bn
+17.833 bn
8.48%
1 ene 1994 año
234.24 bn
+6.072 bn
2.66%
1 ene 1995 año
233.604 bn
-635.67 millones
-0.27%
1 ene 1996 año
247.9 bn
+14.296 bn
6.12%
1 ene 1997 año
251.926 bn
+4.026 bn
1.62%
1 ene 1998 año
272.563 bn
+20.636 bn
8.19%
1 ene 1999 año
276.331 bn
+3.768 bn
1.38%
1 ene 2000 año
263.809 bn
-12.522 bn
-4.53%
1 ene 2001 año
279.76 bn
+15.951 bn
6.05%
1 ene 2002 año
295.847 bn
+16.088 bn
5.75%
1 ene 2003 año
273.788 bn
-22.06 bn
-7.46%
1 ene 2004 año
257.591 bn
-16.197 bn
-5.92%
1 ene 2005 año
313.073 bn
+55.483 bn
21.54%
1 ene 2006 año
356.489 bn
+43.416 bn
13.87%
1 ene 2007 año
403.716 bn
+47.227 bn
13.25%
1 ene 2008 año
450.74 bn
+47.024 bn
11.65%
1 ene 2009 año
483.838 bn
+33.098 bn
7.34%
1 ene 2010 año
471.901 bn
-11.937 bn
-2.47%
1 ene 2011 año
470.553 bn
-1.348 bn
-0.29%
1 ene 2012 año
500.326 bn
+29.773 bn
6.33%
1 ene 2013 año
538.209 bn
+37.883 bn
7.57%
1 ene 2014 año
554.246 bn
+16.038 bn
2.98%
1 ene 2015 año
542.198 bn
-12.048 bn
-2.17%

Ranking de los países por los datos estadísticos actuales