29
/es/
es
AIzaSyAYiBZKx7MnpbEhh9jyipgxe19OcubqV5w
April 1, 2024
138030
Georgia
GEO
true
2
1
GDP, PPP (current international $)
2016,2015,2014,2013,2012,2011,2010,2009,2008,2007,2006,2005,2004,2003,2002,2001,2000,1999,1998,1997,1996,1995,1994,1993,1992,1991
Download
Estadísticas Globales de la Biblioteca →Georgia →

GDP, PPP (current international $)

Estas estadísticas en otros países:
AfghanistanAlbaniaAlgeriaAngolaAntigua and BarbudaArab WorldArgentinaArmeniaArubaAustraliaAustriaAzerbaijanBahamas, TheBahrainBangladeshBarbadosBelarusBelgiumBelizeBeninBermudaBhutanBoliviaBosnia and HerzegovinaBotswanaBrazilBrunei DarussalamBulgariaBurkina FasoBurundiCabo VerdeCambodiaCameroonCanadaCaribbean small statesCayman IslandsCentral African RepublicCentral Europe and the BalticsChadChileChinaColombiaComorosCongo, Dem. Rep.Congo, Rep.Costa RicaCote d'IvoireCroatiaCubaCyprusCzech RepublicDenmarkDjiboutiDominicaDominican RepublicEarly-demographic dividendEast Asia & PacificEast Asia & Pacific (excluding high income)East Asia & Pacific (IDA & IBRD countries)EcuadorEgypt, Arab Rep.El SalvadorEquatorial GuineaEritreaEstoniaEthiopiaEuro areaEurope & Central AsiaEurope & Central Asia (excluding high income)Europe & Central Asia (IDA & IBRD countries)European UnionFijiFinlandFragile and conflict affected situationsFranceGabonGambia, TheGeorgiaGermanyGhanaGreeceGrenadaGuatemalaGuineaGuinea-BissauGuyanaHaitiHeavily indebted poor countries (HIPC)High incomeHondurasHong Kong SAR, ChinaHungaryIBRD onlyIcelandIDA & IBRD totalIDA blendIDA onlyIDA totalIndiaIndonesiaIran, Islamic Rep.IraqIrelandIsraelItalyJamaicaJapanJordanKazakhstanKenyaKiribatiKorea, Rep.KosovoKuwaitKyrgyz RepublicLao PDRLate-demographic dividendLatin America & Caribbean Latin America & Caribbean (excluding high income)Latin America & the Caribbean (IDA & IBRD countries)LatviaLeast developed countries: UN classificationLebanonLesothoLiberiaLibyaLithuaniaLow & middle incomeLow incomeLower middle incomeLuxembourgMacao SAR, ChinaMacedonia, FYRMadagascarMalawiMalaysiaMaldivesMaliMaltaMarshall IslandsMauritaniaMauritiusMexicoMicronesia, Fed. Sts.Middle East & North AfricaMiddle East & North Africa (excluding high income)Middle East & North Africa (IDA & IBRD countries)Middle incomeMoldovaMongoliaMontenegroMoroccoMozambiqueMyanmarNamibiaNauruNepalNetherlandsNew ZealandNicaraguaNigerNigeriaNorth AmericaNorwayOECD membersOmanOther small statesPacific island small statesPakistanPalauPanamaPapua New GuineaParaguayPeruPhilippinesPolandPortugalPost-demographic dividendPre-demographic dividendPuerto RicoQatarRomaniaRussian FederationRwandaSamoaSao Tome and PrincipeSaudi ArabiaSenegalSerbiaSeychellesSierra LeoneSingaporeSint Maarten (Dutch part)Slovak RepublicSloveniaSmall statesSolomon IslandsSouth AfricaSouth AsiaSouth Asia (IDA & IBRD)South SudanSpainSri LankaSt. Kitts and NevisSt. LuciaSt. Vincent and the GrenadinesSub-Saharan Africa Sub-Saharan Africa (excluding high income)Sub-Saharan Africa (IDA & IBRD countries)SudanSurinameSwazilandSwedenSwitzerlandTajikistanTanzaniaThailandTimor-LesteTogoTongaTrinidad and TobagoTunisiaTurkeyTurkmenistanTuvaluUgandaUkraineUnited Arab EmiratesUnited KingdomUnited StatesUpper middle incomeUruguayUzbekistanVanuatuVenezuela, RBVietnamWest Bank and GazaWorldYemen, Rep.ZambiaZimbabwe
línea de tiempo (timeline):
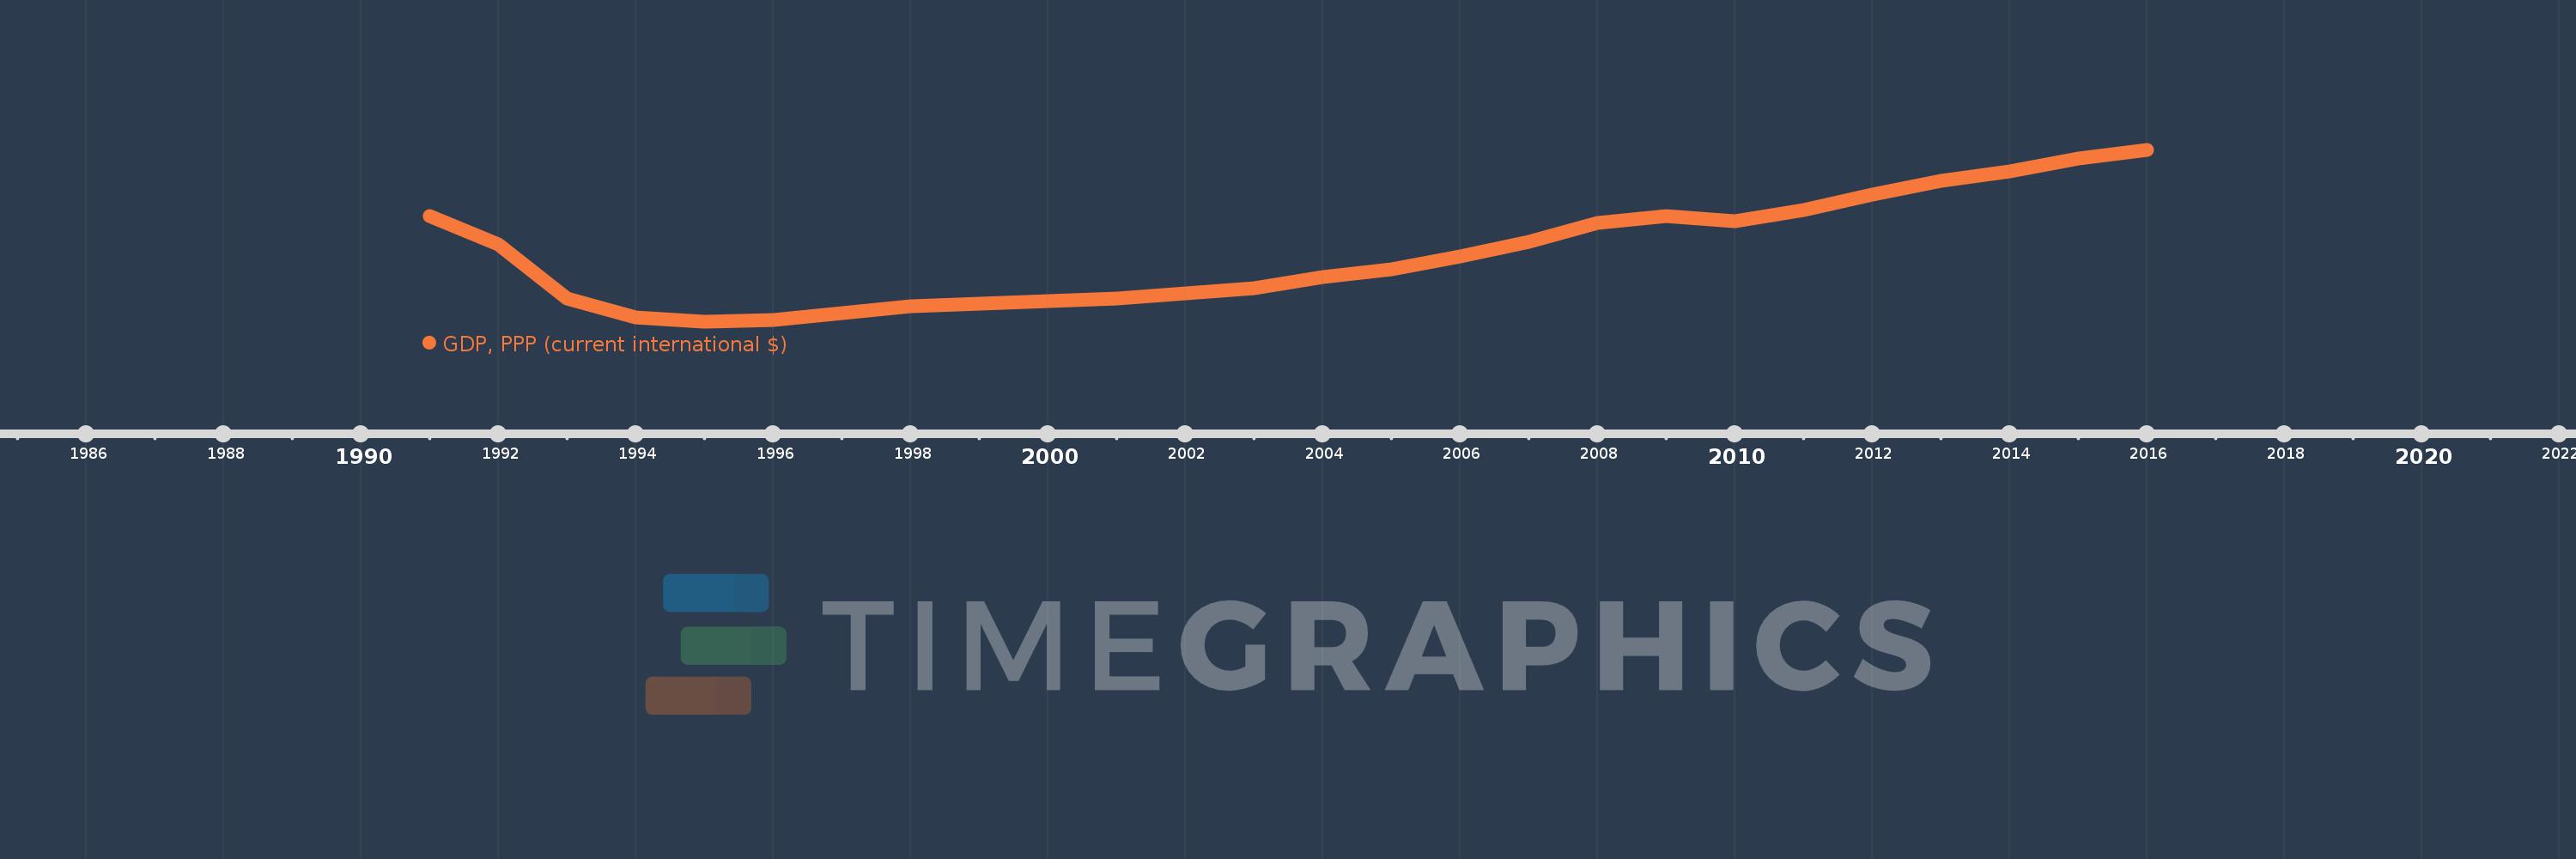
En esta escala de tiempo se presenta un gráfico de 1991 y 2016 de Georgia. Los datos de 1990 están ausentes. El número de observaciones reales por fecha: 26.
Fuente (nombre):
Indicadores del desarrollo mundial
Fuente (organización):
World Bank, International Comparison Program database.
Categorías:
Economy & Growth
Se ha actualizado:
23 abr 2017 año
Los indicadores de los cambios de valor en los últimos años
En promedio:
18.762 bn
Mínimo:
7.572 bn
1 ene 1995 año
Máximo:
35.682 bn
1 ene 2016 año
A la fecha de observación
Valor
Cambio absoluto
El cambio con respecto al valor anterior
1 ene 1991 año
24.881 bn
+24.881 bn
0.0%
1 ene 1992 año
20.285 bn
-4.597 bn
-18.47%
1 ene 1993 año
11.432 bn
-8.853 bn
-43.64%
1 ene 1994 año
8.275 bn
-3.157 bn
-27.62%
1 ene 1995 año
7.572 bn
-702.77 millones
-8.49%
1 ene 1996 año
7.931 bn
+358.893 millones
4.74%
1 ene 1997 año
8.98 bn
+1.049 bn
13.23%
1 ene 1998 año
10.094 bn
+1.114 bn
12.41%
1 ene 1999 año
10.521 bn
+426.369 millones
4.22%
1 ene 2000 año
10.988 bn
+467.485 millones
4.44%
1 ene 2001 año
11.445 bn
+456.635 millones
4.16%
1 ene 2002 año
12.268 bn
+823.324 millones
7.19%
1 ene 2003 año
13.138 bn
+870.177 millones
7.09%
1 ene 2004 año
14.882 bn
+1.744 bn
13.27%
1 ene 2005 año
16.187 bn
+1.305 bn
8.77%
1 ene 2006 año
18.312 bn
+2.125 bn
13.13%
1 ene 2007 año
20.645 bn
+2.334 bn
12.74%
1 ene 2008 año
23.811 bn
+3.166 bn
15.33%
1 ene 2009 año
24.84 bn
+1.029 bn
4.32%
1 ene 2010 año
24.084 bn
-756.38 millones
-3.05%
1 ene 2011 año
25.902 bn
+1.818 bn
7.55%
1 ene 2012 año
28.346 bn
+2.444 bn
9.44%
1 ene 2013 año
30.701 bn
+2.355 bn
8.31%
1 ene 2014 año
32.254 bn
+1.552 bn
5.06%
1 ene 2015 año
34.349 bn
+2.095 bn
6.5%
1 ene 2016 año
35.682 bn
+1.333 bn
3.88%
Ranking de los países por los datos estadísticos actuales

Comentarios:

Enviar
PremiumAbout & FeedbackAcuerdoPrivacidad
logo
© 2022 Selected Technologies LLC – Morgan Hill, California