33
/es/
AIzaSyAYiBZKx7MnpbEhh9jyipgxe19OcubqV5w
August 1, 2025
267687
Tunisia
TUN
true
2
1
Borrowers from commercial banks (per 1,000 adults)
2016,2015,2014,2013,2012,2011,2010,2009,2008,2007,2006,2005,2004,2003,2002
Download
Estadísticas Globales de la Biblioteca →Tunisia →

Borrowers from commercial banks (per 1,000 adults)

Estas estadísticas en otros países:

AfghanistanAlbaniaAlgeriaAngolaArab WorldArgentinaAzerbaijanBangladeshBelgiumBelizeBoliviaBosnia and HerzegovinaBotswanaBrazilBrunei DarussalamBurundiCabo VerdeCameroonCentral African RepublicCentral Europe and the BalticsChadChileChinaColombiaComorosCongo, Dem. Rep.Congo, Rep.Costa RicaCroatiaDjiboutiDominican RepublicEarly-demographic dividendEast Asia & Pacific (excluding high income)East Asia & Pacific (IDA & IBRD countries)EcuadorEgypt, Arab Rep.El SalvadorEquatorial GuineaEstoniaEthiopiaEurope & Central Asia (excluding high income)Europe & Central Asia (IDA & IBRD countries)Fragile and conflict affected situationsGabonGeorgiaGhanaGuatemalaGuineaHaitiHeavily indebted poor countries (HIPC)HondurasHungaryIBRD onlyIDA & IBRD totalIDA blendIDA onlyIDA totalIndonesiaIsraelItalyKenyaKiribatiKosovoKuwaitKyrgyz RepublicLao PDRLate-demographic dividendLatin America & Caribbean Latin America & Caribbean (excluding high income)Latin America & the Caribbean (IDA & IBRD countries)LatviaLeast developed countries: UN classificationLebanonLesothoLiberiaLibyaLow & middle incomeLow incomeLower middle incomeMacedonia, FYRMadagascarMalawiMalaysiaMaldivesMauritaniaMiddle East & North AfricaMiddle East & North Africa (excluding high income)Middle East & North Africa (IDA & IBRD countries)Middle incomeMoldovaMontenegroMozambiqueMyanmarNamibiaNigeriaOther small statesPakistanPalauParaguayPeruPolandPortugalPre-demographic dividendQatarRomaniaRwandaSamoaSan MarinoSao Tome and PrincipeSaudi ArabiaSerbiaSeychellesSierra LeoneSingaporeSmall statesSolomon IslandsSouth AsiaSouth Asia (IDA & IBRD)South SudanSub-Saharan Africa Sub-Saharan Africa (excluding high income)Sub-Saharan Africa (IDA & IBRD countries)SurinameSwazilandSyrian Arab RepublicTajikistanTanzaniaThailandTimor-LesteTunisiaTurkeyUgandaUnited KingdomUpper middle incomeUruguayUzbekistanVanuatuWest Bank and GazaWorldYemen, Rep.ZambiaZimbabwe

línea de tiempo (timeline):

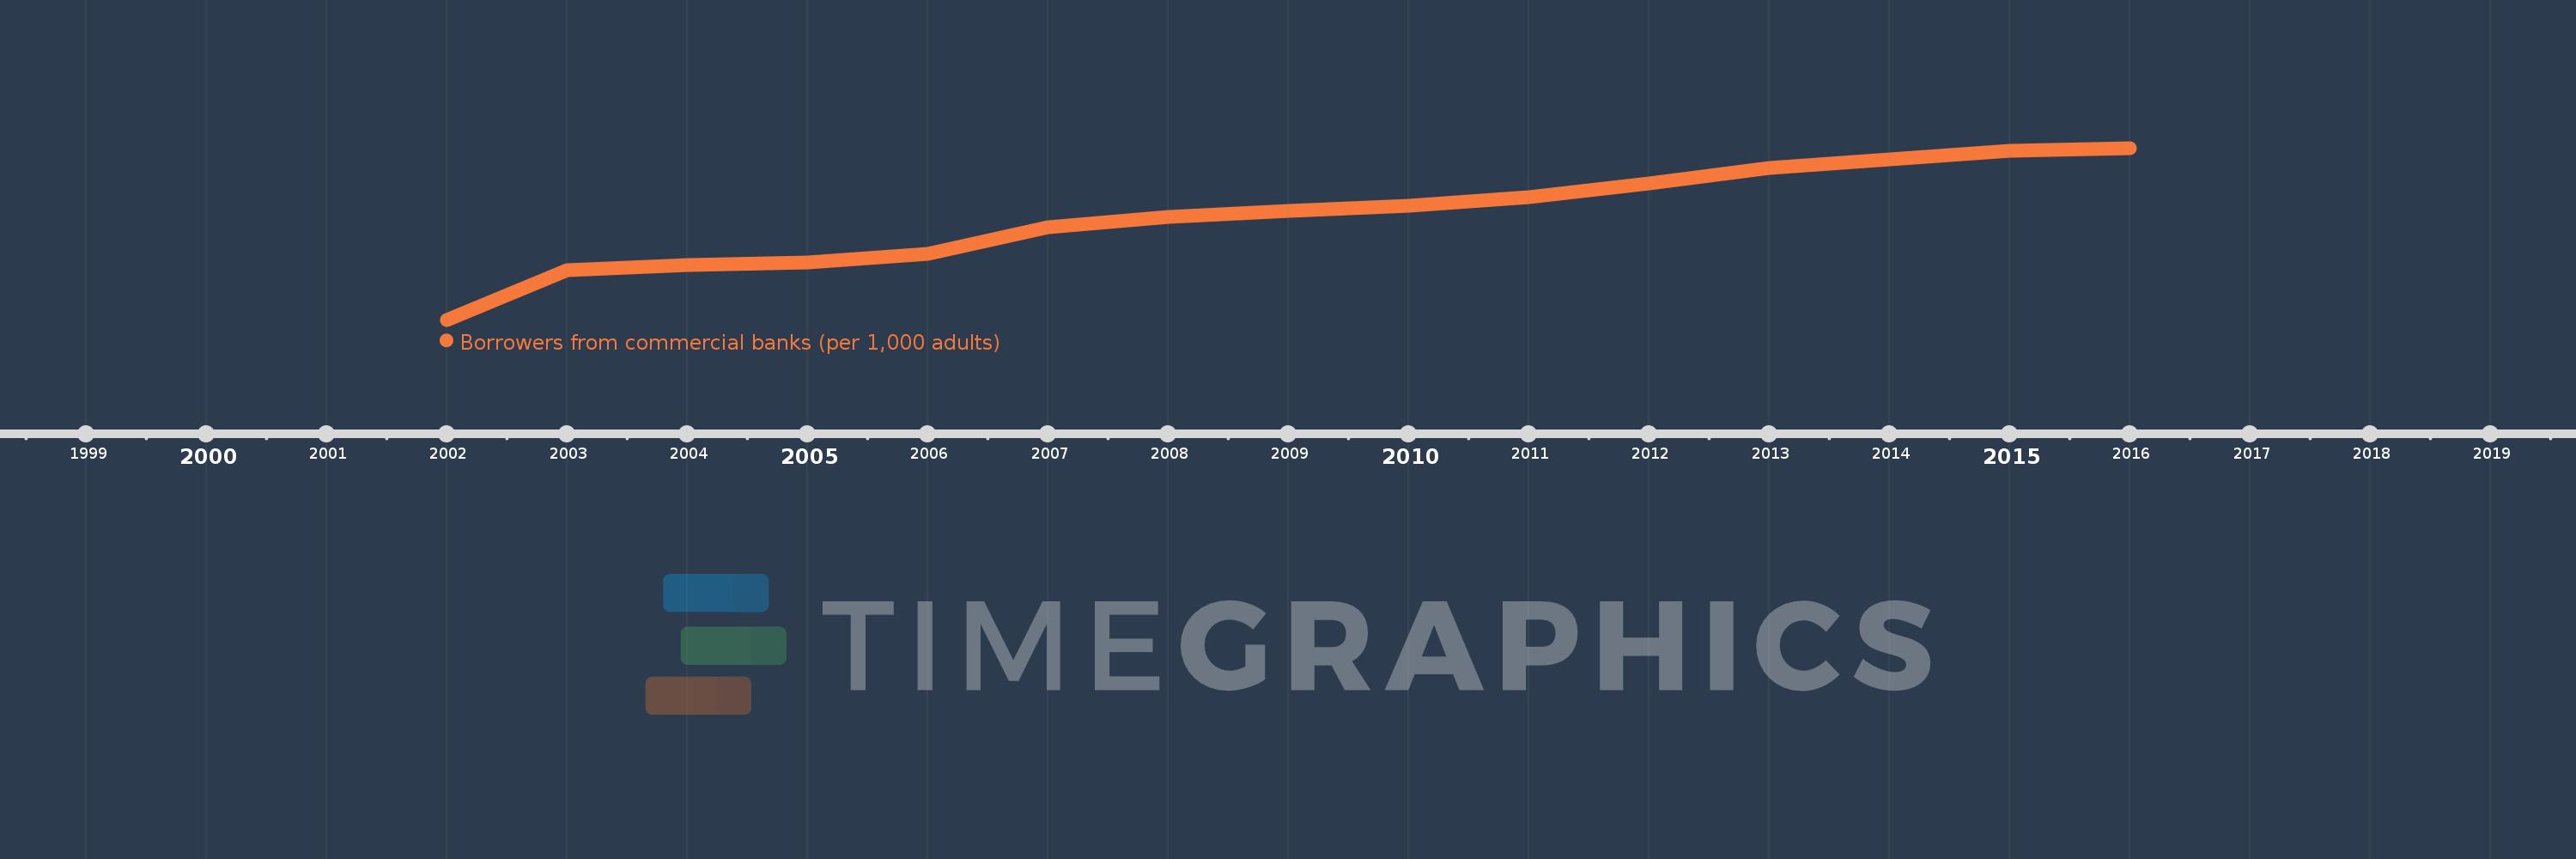
En esta escala de tiempo se presenta un gráfico de 2002 y 2016 de Tunisia. Los datos de 2001 están ausentes. El número de observaciones reales por fecha: 15.

Fuente (nombre):

Indicadores del desarrollo mundial

Fuente (organización):

International Monetary Fund, Financial Access Survey.

Categorías:

Financial Sector

Se ha actualizado:

23 abr 2017 año

Los indicadores de los cambios de valor en los últimos años

En promedio:
132.96
Mínimo:
3.579
1 ene 2002 año
Máximo:
217.688
1 ene 2016 año
A la fecha de observación
Valor
Cambio absoluto
El cambio con respecto al valor anterior
1 ene 2002 año
3.579
+3.579
0.0%
1 ene 2003 año
65.592
+62.013
1.73 mil%
1 ene 2004 año
72.179
+6.587
10.04%
1 ene 2005 año
75.066
+2.887
4.0%
1 ene 2006 año
86.18
+11.114
14.81%
1 ene 2007 año
118.593
+32.413
37.61%
1 ene 2008 año
131.616
+13.023
10.98%
1 ene 2009 año
139.688
+8.072
6.13%
1 ene 2010 año
145.32
+5.632
4.03%
1 ene 2011 año
156.253
+10.933
7.52%
1 ene 2012 año
172.946
+16.694
10.68%
1 ene 2013 año
192.442
+19.496
11.27%
1 ene 2014 año
203.356
+10.914
5.67%
1 ene 2015 año
213.897
+10.54
5.18%
1 ene 2016 año
217.688
+3.791
1.77%

Ranking de los países por los datos estadísticos actuales