33
/es/
AIzaSyAYiBZKx7MnpbEhh9jyipgxe19OcubqV5w
August 1, 2025
124503
Egypt, Arab Rep.
EGY
true
2
1
Borrowers from commercial banks (per 1,000 adults)
2016,2015,2014,2013,2012,2011,2010,2009,2008,2007,2006
Download
Estadísticas Globales de la Biblioteca →Egypt, Arab Rep. →

Borrowers from commercial banks (per 1,000 adults)

Estas estadísticas en otros países:

AfghanistanAlbaniaAlgeriaAngolaArab WorldArgentinaAzerbaijanBangladeshBelgiumBelizeBoliviaBosnia and HerzegovinaBotswanaBrazilBrunei DarussalamBurundiCabo VerdeCameroonCentral African RepublicCentral Europe and the BalticsChadChileChinaColombiaComorosCongo, Dem. Rep.Congo, Rep.Costa RicaCroatiaDjiboutiDominican RepublicEarly-demographic dividendEast Asia & Pacific (excluding high income)East Asia & Pacific (IDA & IBRD countries)EcuadorEgypt, Arab Rep.El SalvadorEquatorial GuineaEstoniaEthiopiaEurope & Central Asia (excluding high income)Europe & Central Asia (IDA & IBRD countries)Fragile and conflict affected situationsGabonGeorgiaGhanaGuatemalaGuineaHaitiHeavily indebted poor countries (HIPC)HondurasHungaryIBRD onlyIDA & IBRD totalIDA blendIDA onlyIDA totalIndonesiaIsraelItalyKenyaKiribatiKosovoKuwaitKyrgyz RepublicLao PDRLate-demographic dividendLatin America & Caribbean Latin America & Caribbean (excluding high income)Latin America & the Caribbean (IDA & IBRD countries)LatviaLeast developed countries: UN classificationLebanonLesothoLiberiaLibyaLow & middle incomeLow incomeLower middle incomeMacedonia, FYRMadagascarMalawiMalaysiaMaldivesMauritaniaMiddle East & North AfricaMiddle East & North Africa (excluding high income)Middle East & North Africa (IDA & IBRD countries)Middle incomeMoldovaMontenegroMozambiqueMyanmarNamibiaNigeriaOther small statesPakistanPalauParaguayPeruPolandPortugalPre-demographic dividendQatarRomaniaRwandaSamoaSan MarinoSao Tome and PrincipeSaudi ArabiaSerbiaSeychellesSierra LeoneSingaporeSmall statesSolomon IslandsSouth AsiaSouth Asia (IDA & IBRD)South SudanSub-Saharan Africa Sub-Saharan Africa (excluding high income)Sub-Saharan Africa (IDA & IBRD countries)SurinameSwazilandSyrian Arab RepublicTajikistanTanzaniaThailandTimor-LesteTunisiaTurkeyUgandaUnited KingdomUpper middle incomeUruguayUzbekistanVanuatuWest Bank and GazaWorldYemen, Rep.ZambiaZimbabwe

línea de tiempo (timeline):

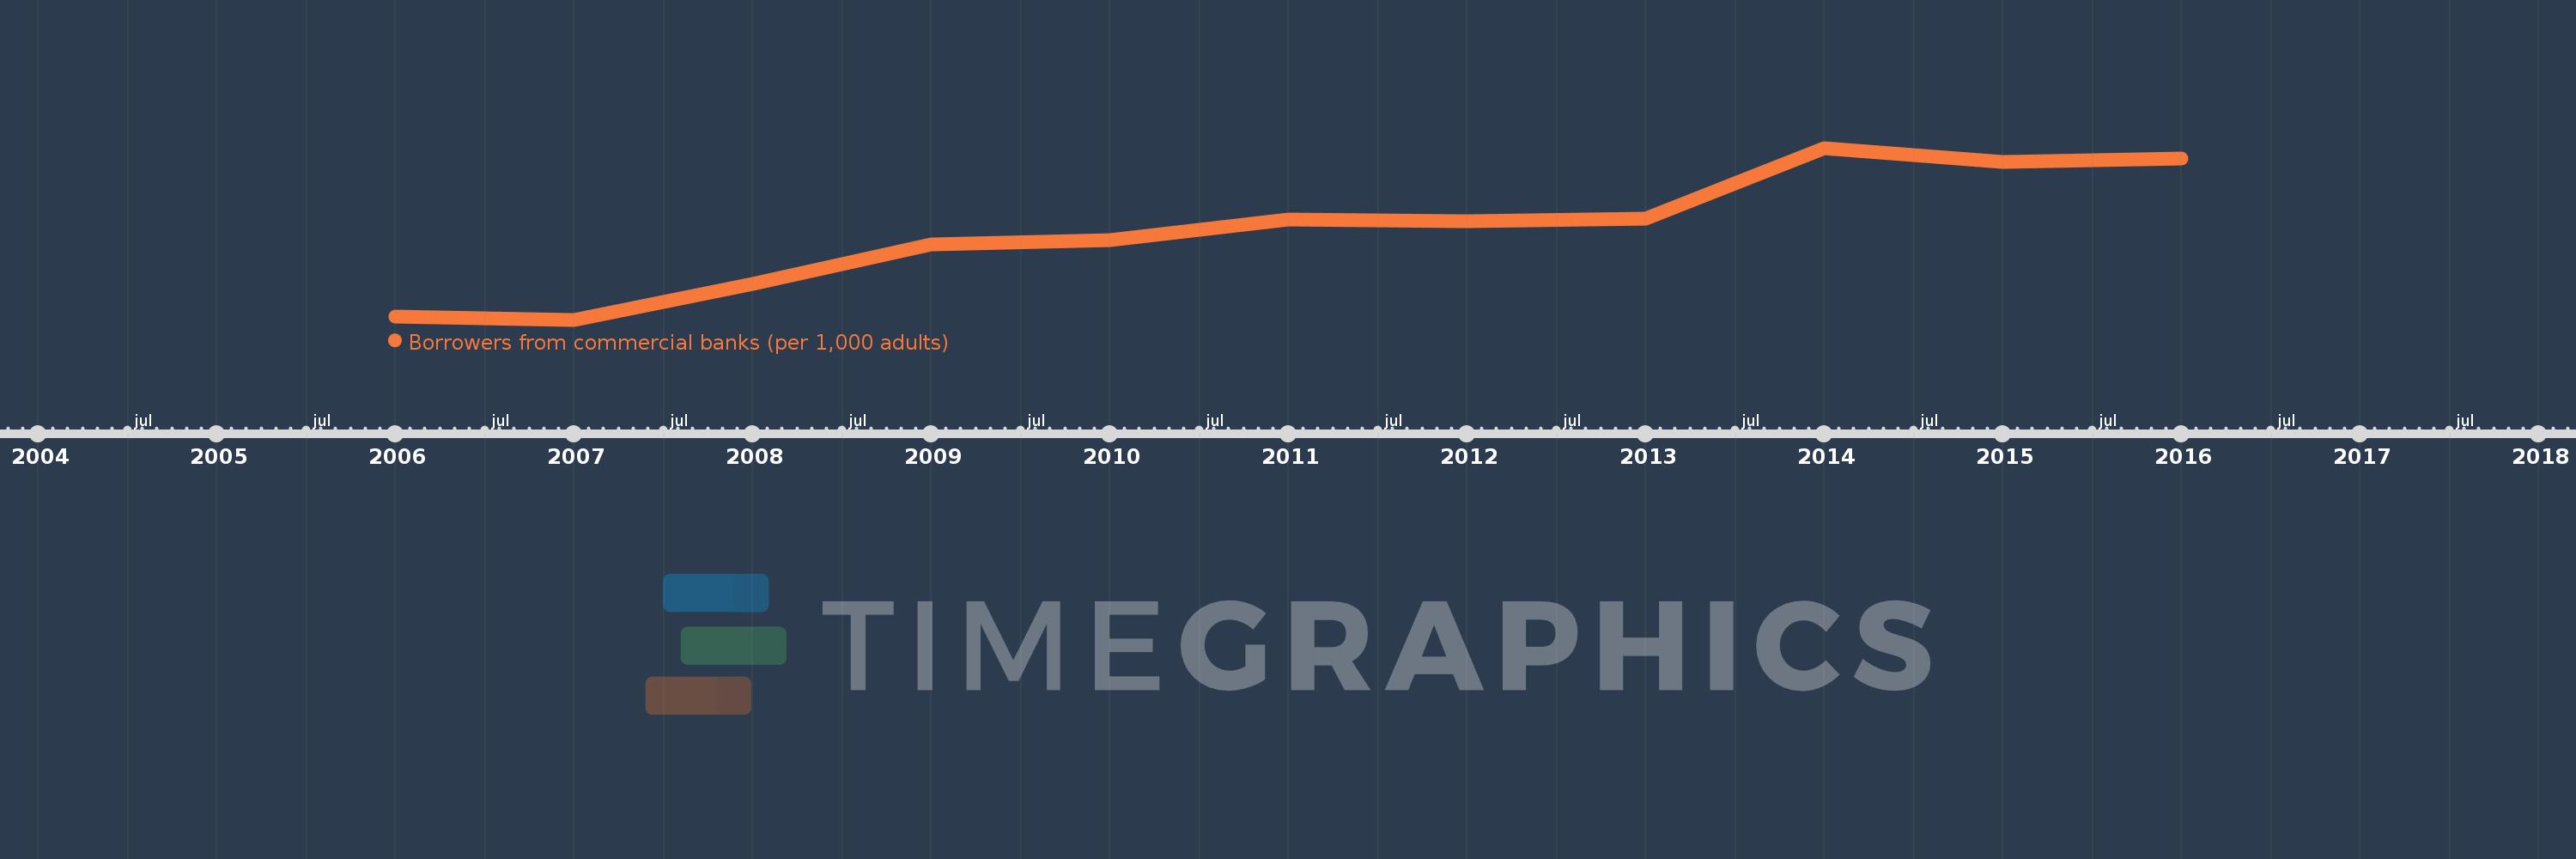
En esta escala de tiempo se presenta un gráfico de 2006 y 2016 de Egypt, Arab Rep.. Los datos de 2005 están ausentes. El número de observaciones reales por fecha: 11.

Fuente (nombre):

Indicadores del desarrollo mundial

Fuente (organización):

International Monetary Fund, Financial Access Survey.

Categorías:

Financial Sector

Se ha actualizado:

23 abr 2017 año

Los indicadores de los cambios de valor en los últimos años

En promedio:
73.524
Mínimo:
37.675
1 ene 2007 año
Máximo:
106.489
1 ene 2014 año
A la fecha de observación
Valor
Cambio absoluto
El cambio con respecto al valor anterior
1 ene 2006 año
38.923
+38.923
0.0%
1 ene 2007 año
37.675
-1.248
-3.21%
1 ene 2008 año
52.049
+14.374
38.15%
1 ene 2009 año
67.933
+15.884
30.52%
1 ene 2010 año
69.503
+1.57
2.31%
1 ene 2011 año
77.94
+8.437
12.14%
1 ene 2012 año
77.29
-0.651
-0.83%
1 ene 2013 año
78.038
+0.748
0.97%
1 ene 2014 año
106.489
+28.451
36.46%
1 ene 2015 año
100.771
-5.719
-5.37%
1 ene 2016 año
102.148
+1.378
1.37%

Ranking de los países por los datos estadísticos actuales