33
/es/
AIzaSyB4mHJ5NPEv-XzF7P6NDYXjlkCWaeKw5bc
November 30, 2025
258356
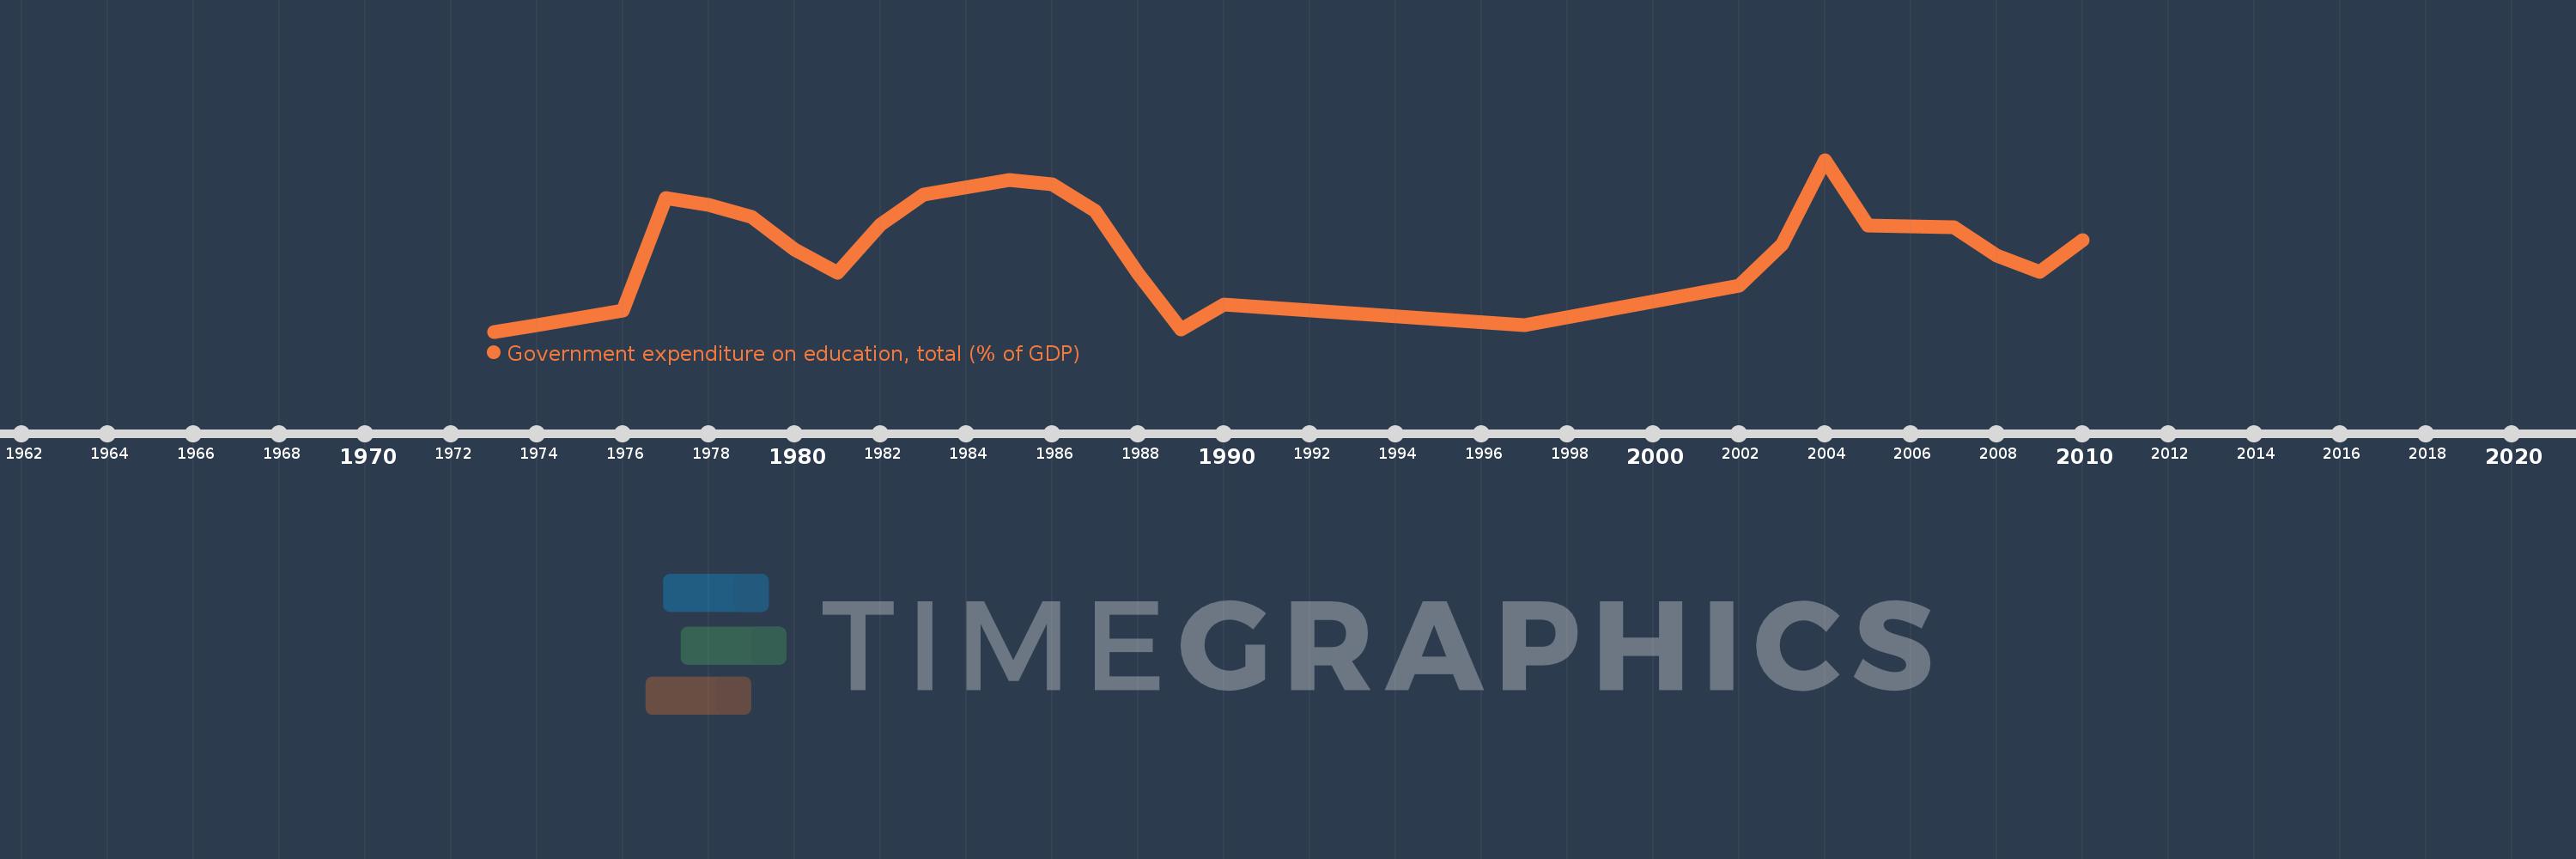
Syrian Arab Republic
SYR
true
2
1
Government expenditure on education, total (% of GDP)
2010,2009,2008,2007,2005,2004,2003,2002,1997,1990,1989,1988,1987,1986,1985,1983,1982,1981,1980,1979,1978,1977,1976,1974,1973