33
/es/
AIzaSyB4mHJ5NPEv-XzF7P6NDYXjlkCWaeKw5bc
November 1, 2025
113621
Cote d'Ivoire
CIV
true
2
1
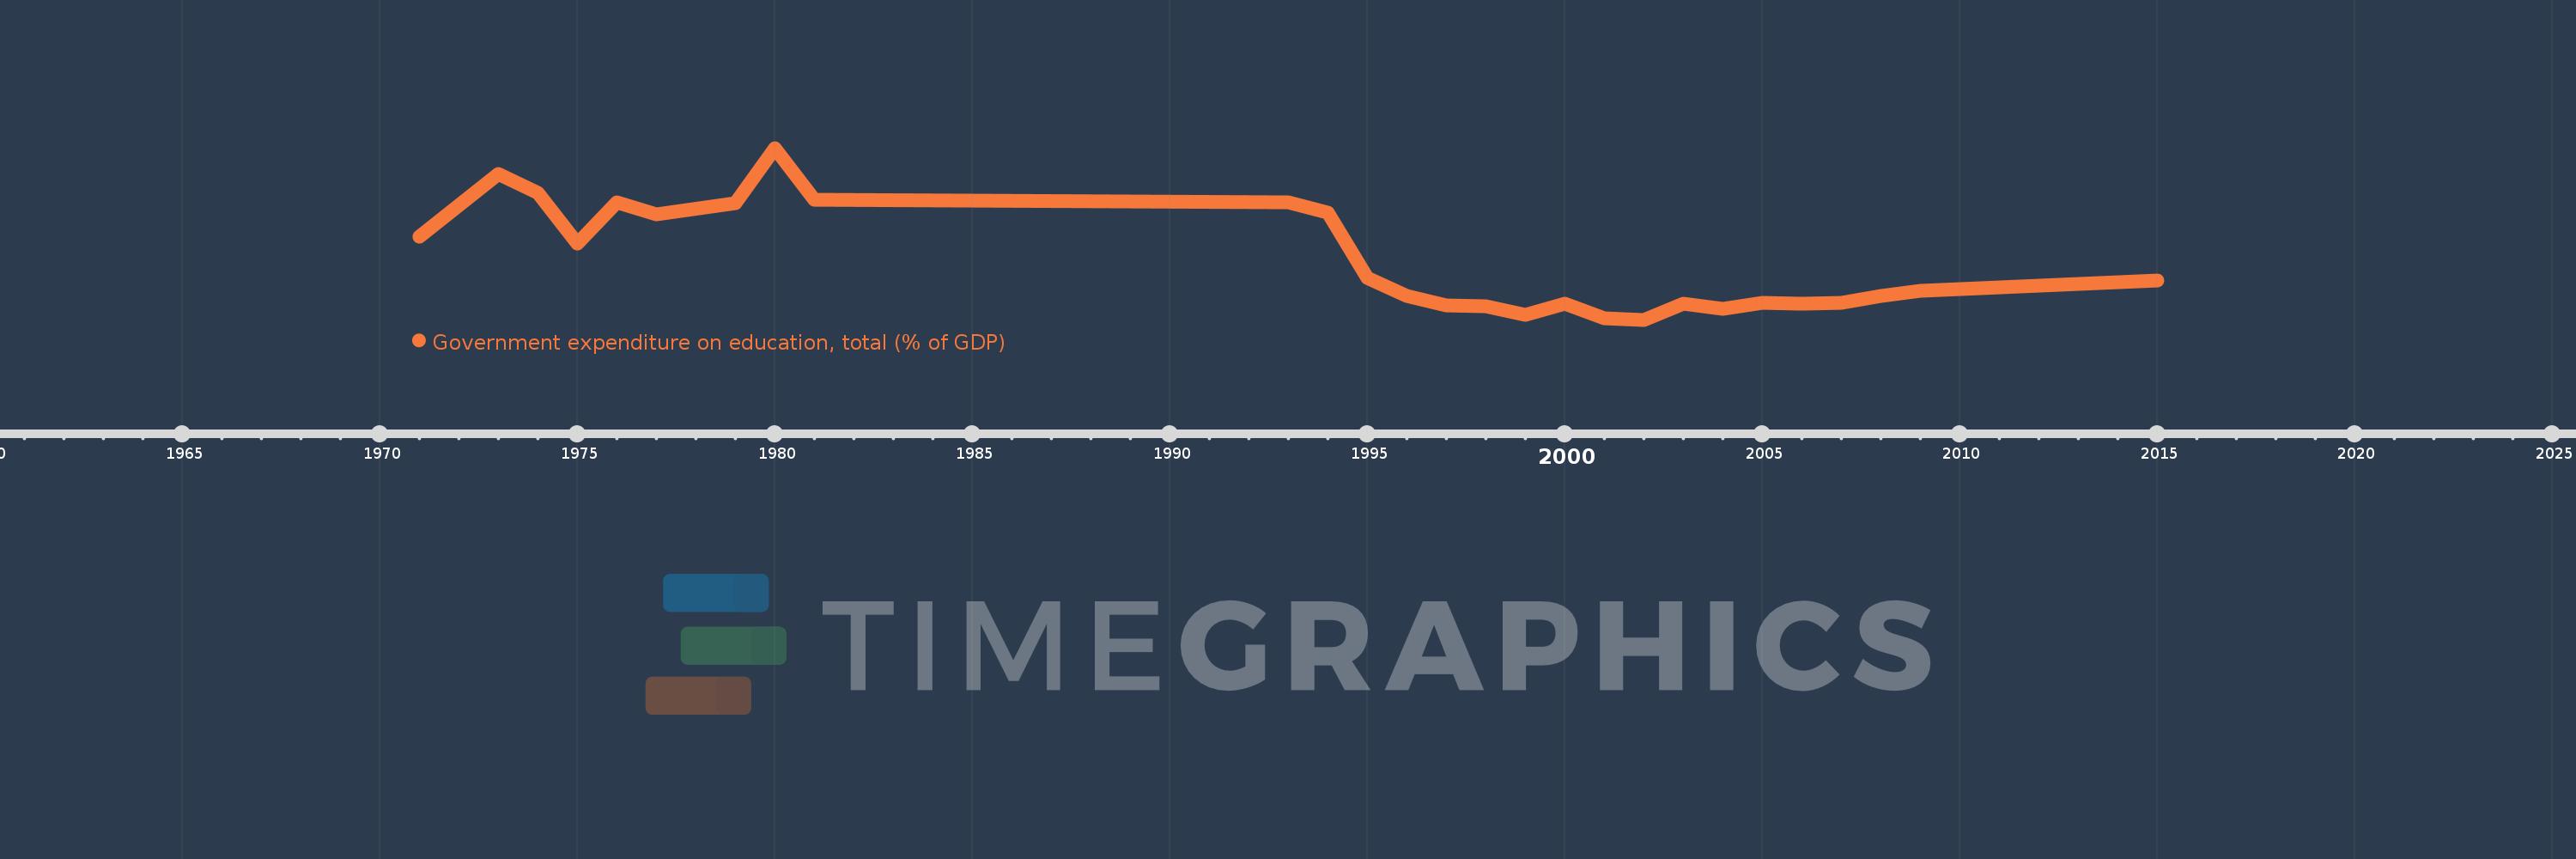
Government expenditure on education, total (% of GDP)
2015,2009,2008,2007,2006,2005,2004,2003,2002,2001,2000,1999,1998,1997,1996,1995,1994,1993,1981,1980,1979,1977,1976,1975,1974,1973,1971