33
/es/
AIzaSyAYiBZKx7MnpbEhh9jyipgxe19OcubqV5w
May 1, 2025
25121
Caribbean small states
CSS
false
2
1
Natural gas rents (% of GDP)
2015,2014,2013,2012,2011,2009,2008,2007,2006,1986,1985,1984,1983,1982,1981,1980,1979,1978,1977,1976,1975,1974,1973
Download
Estadísticas Globales de la Biblioteca →Caribbean small states →

Natural gas rents (% of GDP)

Estas estadísticas en otros países:

AfghanistanAlbaniaAlgeriaAngolaArab WorldArgentinaArmeniaAustraliaAustriaAzerbaijanBahrainBangladeshBarbadosBelarusBelgiumBelizeBeninBoliviaBosnia and HerzegovinaBotswanaBrazilBrunei DarussalamBulgariaCambodiaCameroonCanadaCaribbean small statesCentral Europe and the BalticsChadChileChinaColombiaCongo, Dem. Rep.Congo, Rep.Costa RicaCote d'IvoireCroatiaCubaCyprusCzech RepublicDenmarkDominican RepublicEarly-demographic dividendEast Asia & PacificEast Asia & Pacific (excluding high income)East Asia & Pacific (IDA & IBRD countries)EcuadorEgypt, Arab Rep.El SalvadorEquatorial GuineaEritreaEstoniaEthiopiaEuro areaEurope & Central AsiaEurope & Central Asia (excluding high income)Europe & Central Asia (IDA & IBRD countries)European UnionFinlandFragile and conflict affected situationsFranceGabonGeorgiaGermanyGhanaGreeceGuatemalaHaitiHeavily indebted poor countries (HIPC)High incomeHondurasHungaryIBRD onlyIcelandIDA & IBRD totalIDA blendIDA onlyIDA totalIndiaIndonesiaIran, Islamic Rep.IraqIrelandIsraelItalyJamaicaJapanJordanKazakhstanKenyaKorea, Rep.KosovoKuwaitKyrgyz RepublicLate-demographic dividendLatin America & Caribbean Latin America & Caribbean (excluding high income)Latin America & the Caribbean (IDA & IBRD countries)LatviaLeast developed countries: UN classificationLebanonLibyaLithuaniaLow & middle incomeLow incomeLower middle incomeLuxembourgMacedonia, FYRMalaysiaMaltaMauritiusMexicoMiddle East & North AfricaMiddle East & North Africa (excluding high income)Middle East & North Africa (IDA & IBRD countries)Middle incomeMoldovaMongoliaMontenegroMoroccoMozambiqueMyanmarNamibiaNepalNetherlandsNew ZealandNicaraguaNigerNigeriaNorth AmericaNorwayOECD membersOmanOther small statesPakistanPanamaPapua New GuineaParaguayPeruPhilippinesPolandPortugalPost-demographic dividendPre-demographic dividendQatarRomaniaRussian FederationSaudi ArabiaSenegalSerbiaSingaporeSlovak RepublicSloveniaSmall statesSouth AfricaSouth AsiaSouth Asia (IDA & IBRD)South SudanSpainSri LankaSub-Saharan Africa Sub-Saharan Africa (excluding high income)Sub-Saharan Africa (IDA & IBRD countries)SudanSwedenSwitzerlandSyrian Arab RepublicTajikistanTanzaniaThailandTimor-LesteTogoTrinidad and TobagoTunisiaTurkeyTurkmenistanUkraineUnited Arab EmiratesUnited KingdomUnited StatesUpper middle incomeUruguayUzbekistanVenezuela, RBVietnamWest Bank and GazaWorldYemen, Rep.ZambiaZimbabwe

línea de tiempo (timeline):

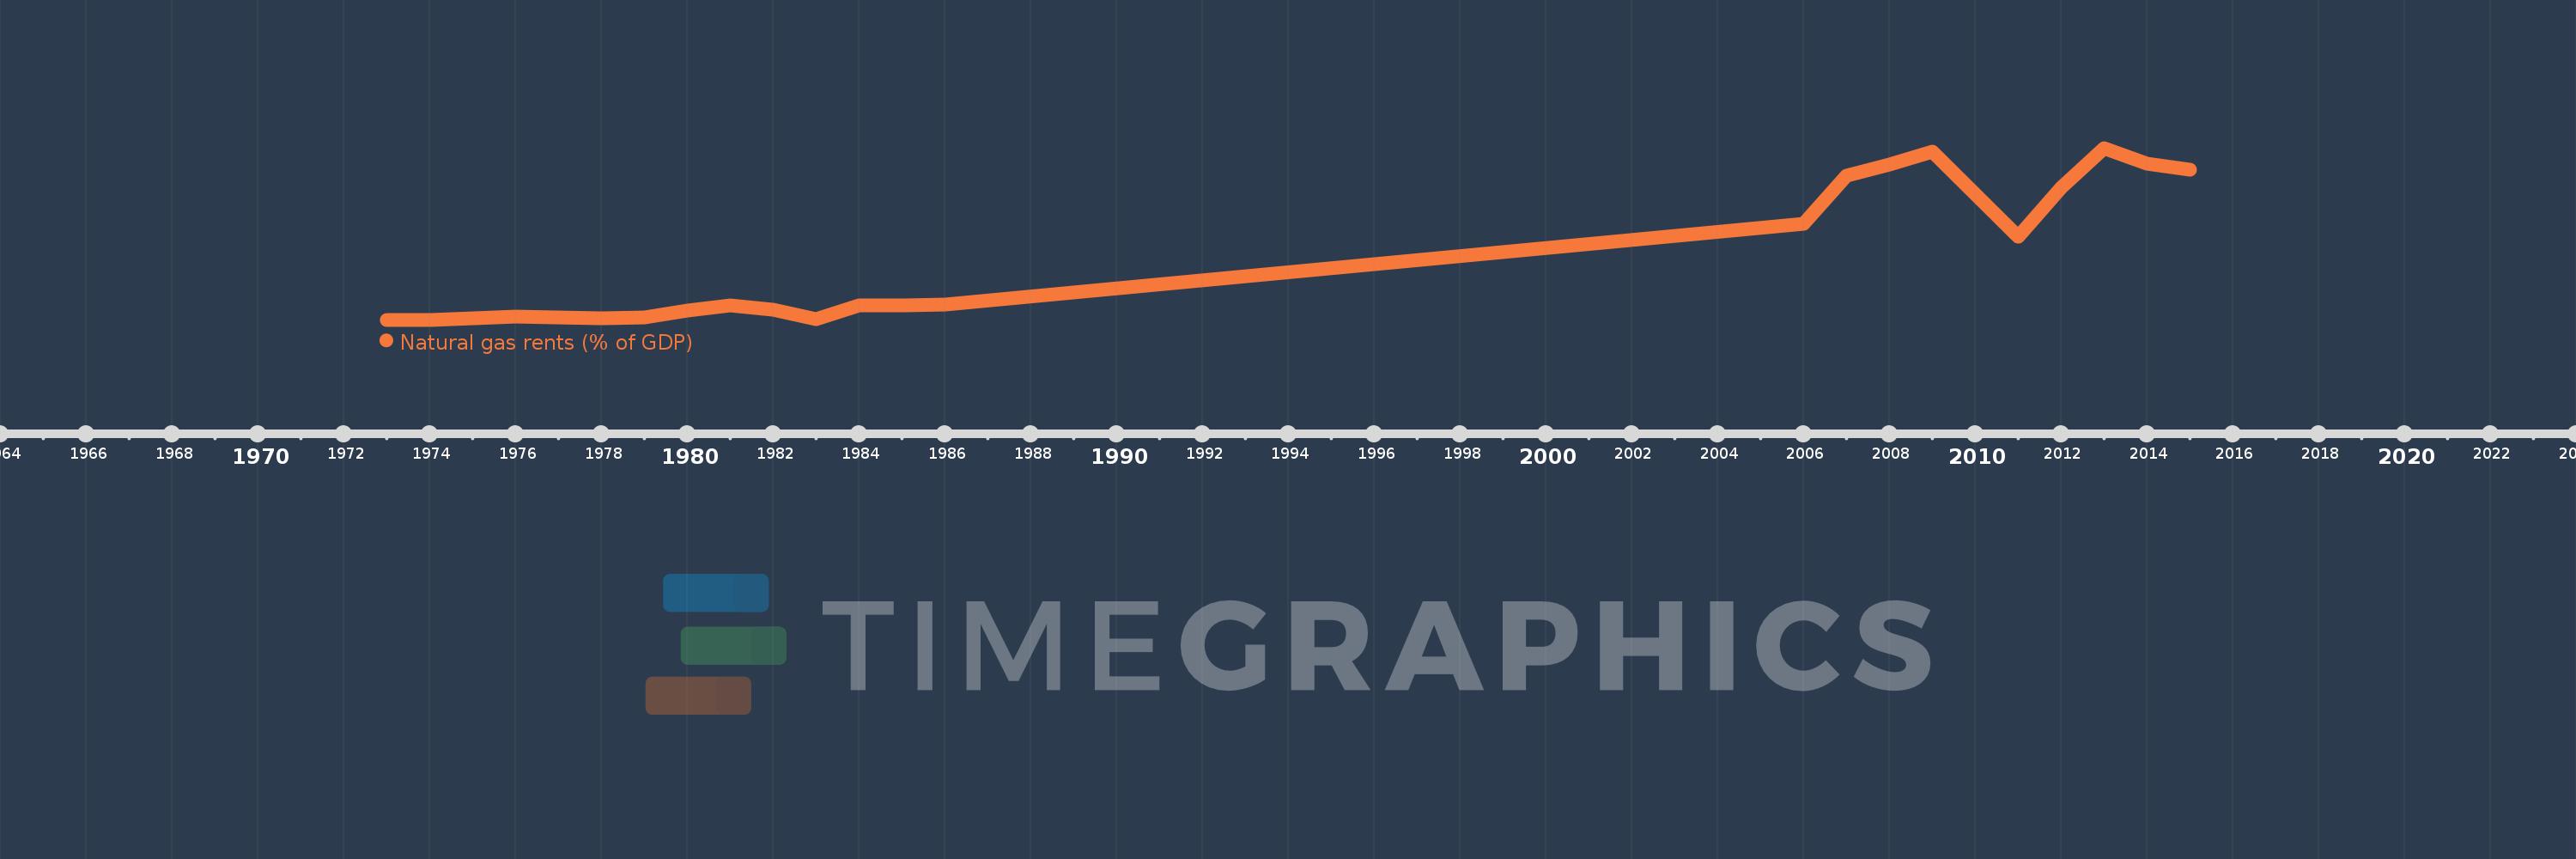
En esta escala de tiempo se presenta un gráfico de 1973 y 2015 de Caribbean small states. Los datos de 1972 están ausentes. El número de observaciones reales por fecha: 23.

Fuente (nombre):

Indicadores del desarrollo mundial

Fuente (organización):

Estimates based on sources and methods described in "The Changing Wealth of Nations: Measuring Sustainable Development in the New Millennium" (World Bank, 2011).

Categorías:

Energy & Mining, Environment

Se ha actualizado:

23 abr 2017 año

Los indicadores de los cambios de valor en los últimos años

En promedio:
2.235
Mínimo:
0.0
1 ene 1973 año
Máximo:
6.559
1 ene 2013 año
A la fecha de observación
Valor
Cambio absoluto
El cambio con respecto al valor anterior
1 ene 1973 año
0.0
0.0
0.0%
1 ene 1974 año
0.0
0.0
%
1 ene 1975 año
0.048
+0.048
%
1 ene 1976 año
0.129
+0.081
168.81%
1 ene 1977 año
0.098
-0.031
-23.84%
1 ene 1978 año
0.069
-0.029
-29.92%
1 ene 1979 año
0.094
+0.026
37.46%
1 ene 1980 año
0.358
+0.263
279.23%
1 ene 1981 año
0.54
+0.182
50.96%
1 ene 1982 año
0.383
-0.157
-29.06%
1 ene 1983 año
0.035
-0.348
-90.82%
1 ene 1984 año
0.534
+0.499
1.42 mil%
1 ene 1985 año
0.55
+0.016
3.01%
1 ene 1986 año
0.587
+0.037
6.8%
1 ene 2006 año
3.67
+3.082
524.66%
1 ene 2007 año
5.502
+1.832
49.93%
1 ene 2008 año
5.941
+0.439
7.98%
1 ene 2009 año
6.43
+0.489
8.23%
1 ene 2011 año
3.175
-3.254
-50.62%
1 ene 2012 año
5.027
+1.852
58.34%
1 ene 2013 año
6.559
+1.532
30.47%
1 ene 2014 año
5.951
-0.608
-9.27%
1 ene 2015 año
5.717
-0.234
-3.93%

Ranking de los países por los datos estadísticos actuales